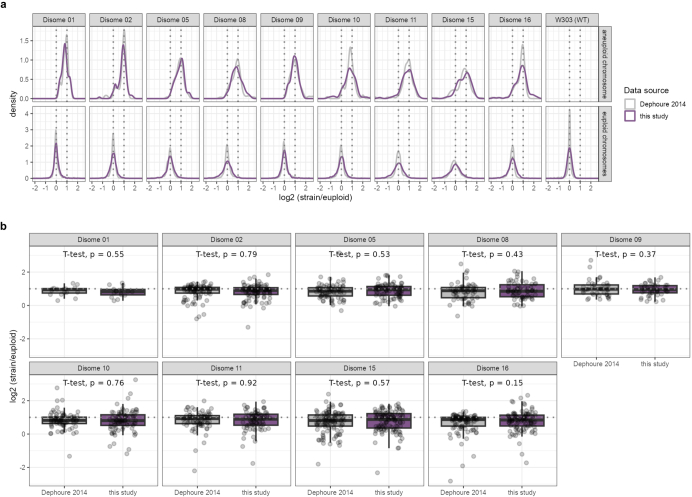
Extended Data Fig. 10. Comparison of the attenuation of proteins located on aneuploid chromosomes between a previously published SILAC proteomic dataset on lab-engineered synthetic disomes and this study.
a, Distribution of relative protein expression levels (log2 strain/euploid) on aneuploid (top) and euploid (bottom) chromosomes across strains of the disomic strain collection. Distributions based on measurements by Dephoure et al.10 are displayed in grey, the ones based on this study in purple. The dotted lines mark expected log2 protein expression levels for proteins located on euploid chromosomes (0) and ones located on duplicated chromosomes (1). b, Comparison of the median log2 protein expression of proteins located on aneuploid chromosomes of disomic strains between the data published by Dephoure et al.10 and this study (two-sample, two-sided T-test, disome 01: n = 16; disome 02: n = 96; disome 05: n = 81; disome 08: n = 65; disome 09: n = 45; disome 10: n = 86; disome 11: n = 79; disome 15: n = 114; disome 16: n = 99 proteins). In the box plots, the centre marks the median, hinges mark the 25th and 75th percentiles and whiskers show all values that, at maximum, fall within 1.5 times the interquartile range.

