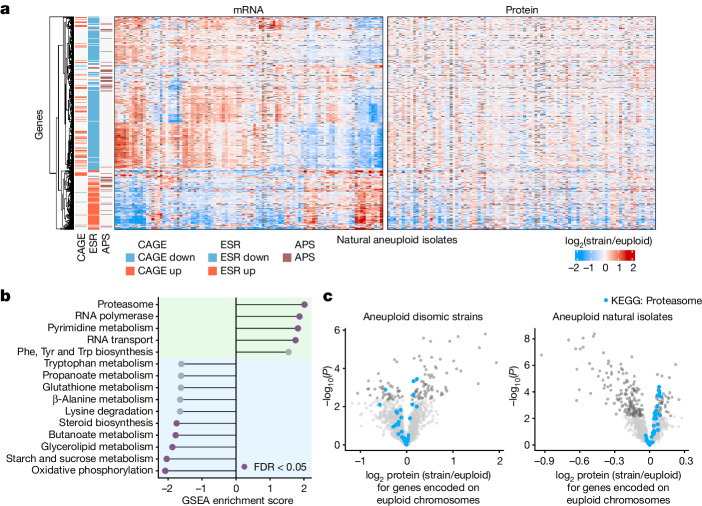
Fig. 4. Analysis of the trans expression response in natural aneuploid isolates.
a, mRNA and protein trans expression (log2 isolate/euploid) of genes previously implicated in the global response to aneuploidy across natural aneuploid isolates (n = 95). Genes annotated as CAGE genes34, ESR genes3,44 and APS genes10 are clustered to the left of the heat maps, with the direction of the regulation described in the reference papers indicated in red (up) or blue (down). Genes that are located on aneuploid chromosomes in a respective isolate are omitted from trans expression analyses and are therefore shown in grey. b, GSEA of median log2 protein expression ratios (isolate/euploid) for genes encoded on all euploid chromosomes across aneuploid natural isolates (n = 95, genes in trans of aneuploid chromosomes). Statistically significant enrichment scores (false discovery rate (FDR) < 0.05) are coloured in purple. The green background highlights gene sets with positive enrichment scores, the blue one gene sets with negative enrichment scores. c, Volcano plots for natural isolates (n = 95) and disomic strains (n = 9, biological triplicates) showing the results of one-sample, two-sided t-tests comparing the mean log2 protein ratios to μ = 0. Proteins with statistically significant differential expression after multiple hypothesis correction (Benjamini–Hochberg) are coloured in dark grey. Structural components of the proteasome are highlighted in blue.

