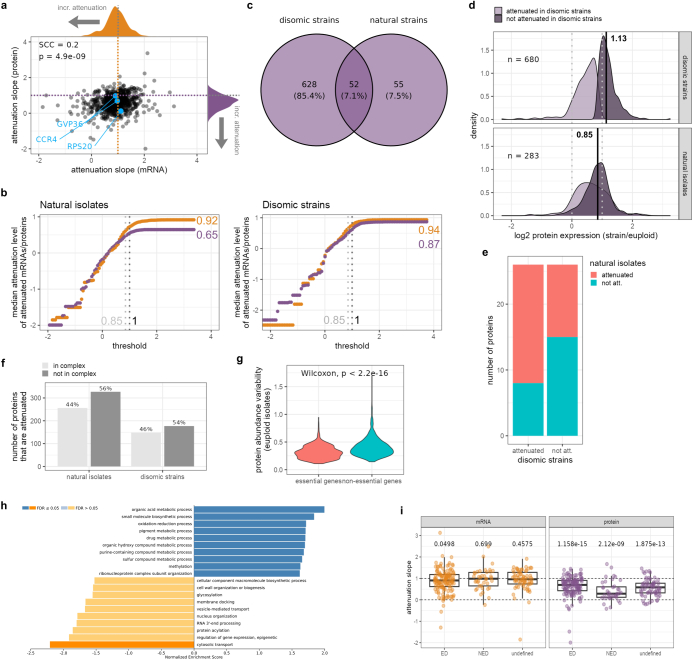
Extended Data Fig. 2. Quantification of dosage compensation 1.
a, mRNA and protein attenuation slopes for the 827 genes (black points) evaluated in the linear regression in natural isolates. Specific genes mentioned and named in Fig. 2a are highlighted in blue. The orange and purple dotted lines depict the expected slope for genes with no attenuation at either the mRNA or protein level, respectively. The distributions of the mRNA and protein regression slopes are shown at the top and right of the scatter plot, respectively. SCC: Spearman correlation coefficient, p = 4.9 * 10−9 (two-sided). b, “Rolling threshold” (cumulative distribution) analysis for natural isolates and disomic strains comparing the effect size of attenuation at the mRNA (orange) or protein level (purple) based on the distribution slopes. The median attenuation level of all attenuated mRNAs or proteins at a given threshold was calculated. The vertical dotted light grey line denotes a threshold of 0.85 that was used for subsequent analyses, the darker grey dotted line denotes 1 (slope if no attenuation occurs). c, Venn diagram showing numbers of proteins for which a regression analysis to determine the extent of buffering at the protein level could be performed and that were expressed from genes located on duplicated chromosomes in disomic strains (680/680 proteins on which regression analysis was performed, from 9 strains), or on duplicated chromosomes in haploid as well as diploid natural isolates (107/827 proteins on which regression analysis was performed, from 13 isolates). d, Disomic and natural isolate log2 protein expression distributions for proteins from c, with those proteins that were determined to be attenuated in disomic strains shown in light purple, and those that were not attenuated in disomic strains shown in dark purple. The dotted lines mark 0 and 1 (expected euploid and duplicated log2 expression value, respectively), and the black line and number mark the respective median of the distribution of those proteins that are not attenuated in disomic strains. For the disomic strains, all 680 proteins were used to draw the protein expression distributions shown in d; for natural isolates, the 52 overlapping proteins from c were used. Because these 680 proteins appear exactly once on a duplicated chromosome in the disomic strain (only one disomic isolate per chromosome in the collection), and the 52 overlapping proteins appear on duplicated aneuploid chromosomes in multiple natural isolates, the total number of data points used to draw the distributions is n = 680, and n = 283 ( > 52), respectively. The number of attenuated versus not attenuated values in the distributions shown for the disomic strains was 325 and 355, respectively; and for the natural isolates, 145 and 138, respectively. Proteins that are not attenuated in the synthetic aneuploids (median log2 protein expression of 1.13), are, on average, nonetheless attenuated in the natural disomes (median log2 protein expression of 0.85). e, Bar plot showing whether proteins that are attenuated or not attenuated in disomic strains are attenuated or not in natural isolates as well. f, Proportion of genes attenuated at the protein level that are in a protein complex (light grey) or not part of a complex (dark grey). g, Variability (standard deviation) of protein abundance levels across euploid isolates for essential versus non-essential genes. Distributions medians were compared using a two-sample, two-sided Wilcoxon test (p < 2.2 * 10−16). h, GSEA of the differences between mRNA and protein abundance variability (measured as standard deviation) across euploid isolates. Positive normalized enrichment scores indicate higher variability at the mRNA versus the protein abundance level, negative normalized enrichment scores indicate higher variability at the protein versus the mRNA abundance. i, Comparison of mRNA and protein attenuation of yeast proteins predicted to be exponentially degraded (ED, n = 138), non-exponentially degraded (NED, n = 39), and undefined (n = 69) based on work in a human aneuploid cell line25. “Attenuation slope” refers to the slope determined in the attenuation regression analysis (compare Fig. 2 and Methods), with slopes close to 1 (or >1) marking no attenuation. Each dot represents the attenuation slope of a single gene at the mRNA or protein level. The adjusted p-values (Benjamini–Hochberg) of one-sample, two-sided t-tests comparing the mean of each group to the expected value if no attenuation occurs (µ = 1) are shown above the box plots. Box plot hinges mark the 25th and 75th percentiles and whiskers show all values that, at maximum, fall within 1.5 times the interquartile range.

