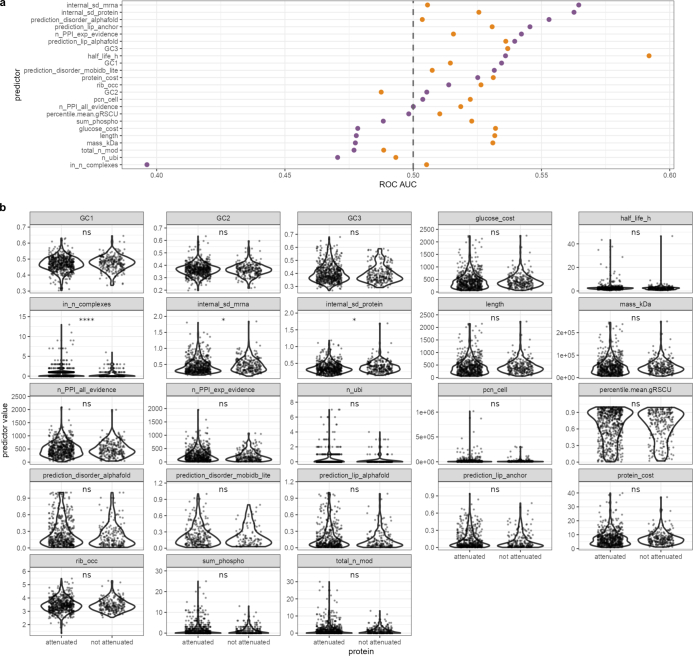
Extended Data Fig. 3. Quantification of dosage compensation 2.
a, Comparison of the area under curve (AUC) of the receiver operator characteristic (ROC) for different features that could influence attenuation. ROC AUC values are shown for both attenuation prediction at the mRNA (orange dots) and at the protein (purple dots) level. b, Comparison of features (panels) between proteins (dots) that are attenuated (n = 583) and not attenuated (n = 244) in natural aneuploid yeast isolates. The Benjamini–Hochberg-adjusted p-value significance levels of two-sample, two-sided Wilcoxon tests (attenuated versus not attenuated for each feature) are shown above the violin plots (internal_sd_mrna: p = 0.034; internal_sd_protein: p = 0.034; in_n_complexes: p = 9.3 * 10−7; ns: p > 0.05 after multiple hypothesis correction). In a and b, the following features are displayed: internal_sd_protein = standard deviation of protein abundance across all euploid isolates of the collection; n_PPI_all_evidence and n_PPI_exp_evidence = number of protein:protein interactions (PPIs) the protein is taking part in, both on the level of overall determined PPIs, as well as for only experimentally confirmed PPIs (STRING db); internal_sd_mrna = standard deviation of mRNA abundance across all euploid isolates of the collection; prediction_disorder_alphafold and prediction_disorder_mobidb_lite = protein disorder as predicted by alphafold and MobiDBi, respectively; prediction_lip_anchor and prediction_lip_alphafold = occurrence of linear interacting peptides (short linear motifs in disordered protein regions) in gene sequence as predicted by ANCHOR and AlphaFold, respectively; GC1, GC2, GC3 = GC content at first, second and third codon position, respectively; rib_occ = ribosome occupancy; percentile_mean_gRSCU = codon optimization of the gene; protein_cost and glucose_cost = amino acid and glucose synthesis cost used to built each protein; pcn_cell = absolute protein copy number per cell; length and mass_kDa = length in amino acids and mass of protein in kDa, respectively; half_life_h = protein half-life in h; sum_phospho and n_ubi = number of phosphorylation and ubiquitination sites per protein; total_n_mod = total number of modification sites per protein; in_n_complexes = total number of complexes a protein is part of.

