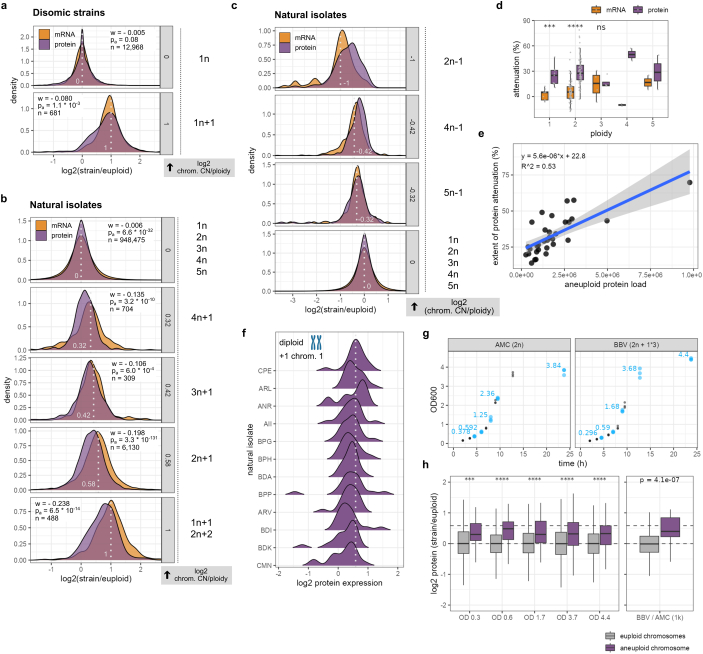
Extended Data Fig. 4. Quantification of dosage compensation 3.
a–c, Distributions of log2 mRNA (orange) and protein (purple) ratios across all euploid or aneuploid chromosomes of disomic strains (a); natural isolates (b); of all euploid natural isolates as well as natural isolates with chromosome losses (c). Genes are binned according to the relative copy number (CN) change of the chromosome encoding them (log2 chrom. CN/ploidy, grey). Log2 ratios of all genes encoded on euploid chromosomes are summarized in panels “0” (0: chromosome CN equal to ploidy), log2 ratios of genes encoded on aneuploid chromosomes are summarized in the other panels (−1–1: aneuploid chromosome gains (a,b) or losses (c) in haploid, diploid, triploid, or tetraploid isolates). Light grey dotted lines and numbers – relative chromosome CN change (log2 chrom. CN/ploidy) in the density plots. Test statistic (w), adjusted p-value (pa, Benjamini–Hochberg), and observations (n) for two-sample Wilcoxon tests conducted to compare mRNA and protein distributions for each relative chromosome CN change in a and b are shown. For all distributions, relative expression levels are shown between −1.5 and 2.5. d, Comparison of mRNA- and protein-level buffering of aneuploid isolates (grey dots) across base ploidy. Statistical significance of the difference between mRNA and protein distributions per ploidy is indicated (two-sample, two-sided t-test, for ploidy = 1: n = 9, p = 0.00026; ploidy = 2: n = 68, p =<2 * 10−16; ploidy = 3: n = 4, p = 0.78; no tests performed for tetra- and pentaploid isolates due to low number of isolates). We note that attenuation at the mRNA level in triploid aneuploid isolates appears stronger than in diploid or tetraploid isolates. However, there that are only four aneuploid triploid isolates with a single relative chromosome copy number change across all aneuploid chromosomes present in the dataset (in contrast to a higher number of haploid and diploid isolates), and we thus suspect that this observation might be an outlier rather than a true biological difference. e, Relationship between the median extent of protein-level buffering across isolates with the same degree of aneuploidy (black dots) and the degree of aneuploidy, measured as the sum of copies of all proteins encoded on all aneuploid chromosomes per isolate. Blue line: linear model, grey band: 95% confidence interval, R^2 = adjusted R2 of linear regression, p = 1.6 * 10−6 (two-sided). f, Relative protein expression distributions of genes encoded on the aneuploid chromosome of diploid natural isolates that gained one copy of chromosome 1 (2n + 1*1). The dashed grey line indicates the expected median of the log2 distribution in case no attenuation occurred. g, 24 h growth curves of a euploid isolate (AMC) and an aneuploid isolate (BBV) after dilution from a pre-culture (t = 0 h, OD600 = 0.1). The OD was regularly monitored, and samples for proteomics were taken at five time points (highlighted in blue). The experiment was performed in biological triplicates. The median OD600 at the time points when samples were collected is shown. h, Left, box plots showing the distributions of log2 protein ratios of all genes encoded on the euploid chromosomes (grey) or the singly gained aneuploid chromosome (purple) at five different ODs across the growth curve from g. The median of the distributions is marked with a solid black line within the boxes. The displayed p-value significance levels are derived from two-sample, two-sided t-tests performed per OD between euploid and aneuploid data points (OD 0.3: n (euploid) = 2163, n (aneuploid) = 55, p = 0.00031; OD 0.6: n (euploid) = 2403, n (aneuploid) = 62, p = 1.4 * 10−8; OD 1.7: n (euploid) = 2701, n (aneuploid) = 71, p = 1.3 * 10−7; OD 3.7: n (euploid) = 2940, n (aneuploid) = 72, p = 8.4 * 10−5; OD 4.4: n (euploid) = 3089, n (aneuploid) = 80, p = 6.4 * 10−8). Only log2 ratios between −2 and 2 are shown to improve readability, and outliers are truncated. Right, relative protein expression levels between the aneuploid isolate BBV and the euploid AMC in the main dataset (795 isolates x 1,653 proteins). In box plots, the centre marks the median, hinges mark the 25th and 75th percentiles and whiskers show all values that, at maximum, fall within 1.5 times the interquartile range.

