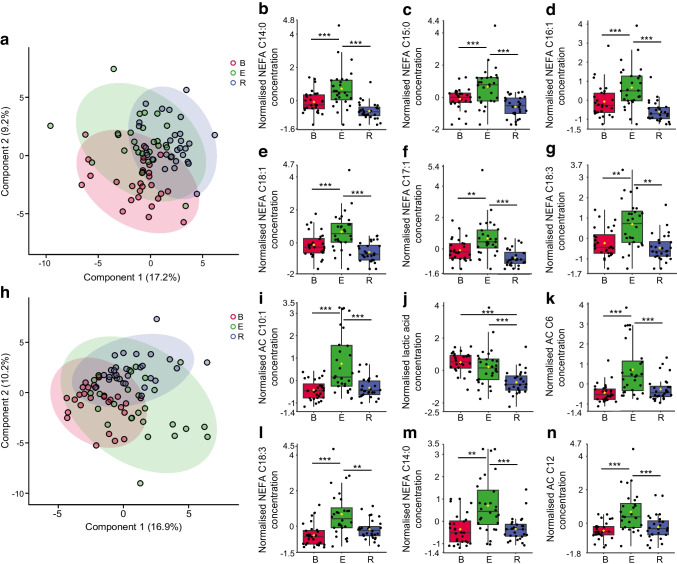
Fig. 2.
The metabolic profile of aerobic exercise in non-diabetic control participants and participants with type 1 diabetes. (a) Multivariate PLS-DA plot of metabolomic data from baseline (red), exercise (green) and post-exercise 1 h recovery (blue) of non-diabetic control participants identifying metabolic differences between the three states. 95% confidence regions are displayed (n=30). (b–g) The top six metabolites representing the metabolic profile of aerobic exercise in non-diabetic control participants (ranked by univariate p value; ESM Table 8) (n=30). (h) Multivariate PLS-DA plot of metabolomic data from baseline (red), exercise (green) and post-exercise 1 h recovery (blue) of people with type 1 diabetes identifying metabolic differences between the three states. 95% confidence regions are displayed (n=30). (i–n) The top six metabolites representing the metabolic profile of aerobic exercise in people with type 1 diabetes (ranked by univariate p value; Table 4) (n=30). Mean-centred and auto-scaled (normalised) data are shown. Box and whisker plots show 25th and 75th percentile and the median. Upper whisker is Q3+1.5×IQR, lower whisker is Q1−1.5×IQR. Yellow point is median value. ***p<0.001, **p<0.01. B, baseline; E, exercise; R, post-exercise 1 h recovery

