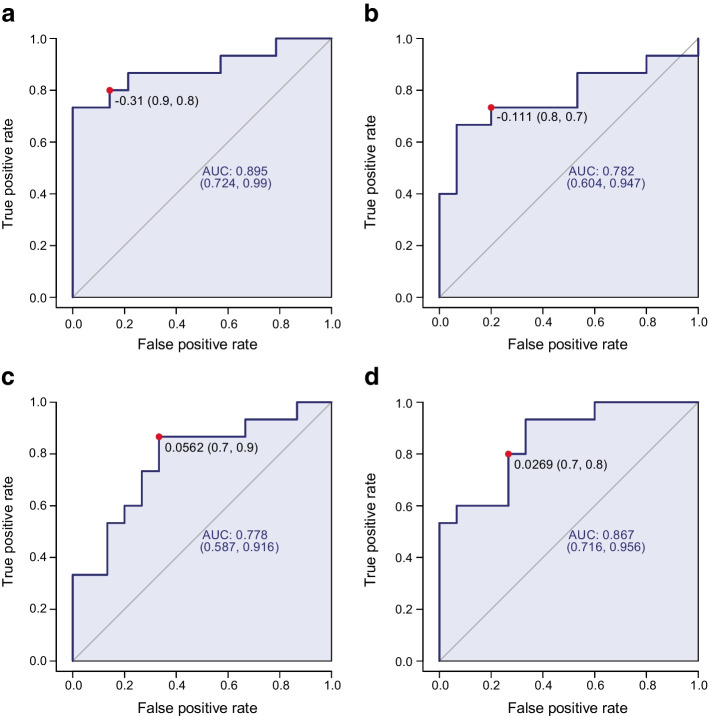
Fig. 5.
ROC curve diagnostic assessment of maximal aerobic capacity (distinguishing top and bottom 50% of population for ) for NEFA 16:1 in baseline serum of healthy control participants (p=0.0026) (a), and pyruvate (p=0.013) (b), malic acid (p=0.013) (c) and the malic acid/pyruvate ratio (p=0.00018) (d) in baseline serum of participants with type 1 diabetes. ROC curves indicate cut offs, sensitivity, specificity, AUC and 95% CI. The diagonal line represents points at which the false positive rates = the true positive rates. The red dot indicates the optimal cutoff with the associated sensitivity and specificity values. Control participants, n=30; participants with type 1 diabetes, n=30

