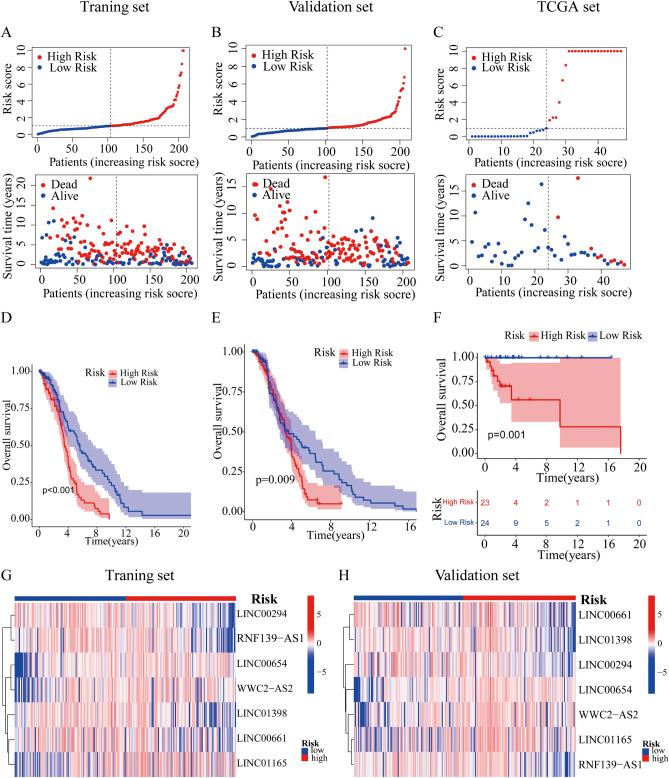
Figure 3.
Validation of the lncRNA-based prognostic risk model in the training set and validation set and TCGA set. Risk score distribution of patients with DLBCL based on cuproptsis-related lncRNAs and scatter dot plot showed the association between the risk score distribution and the survival time in training set (A), validation set (B) and TCGA set (C). The Kaplan–Meier survival curve displayed the OS rate in DLBCL patients in training set (D), validation set (E) and TCGA set (F). Heat maps of expression of the 7 lncRNAs signals associated with cuproptosis in training set (G) and validation set (H).

