Figure 1.
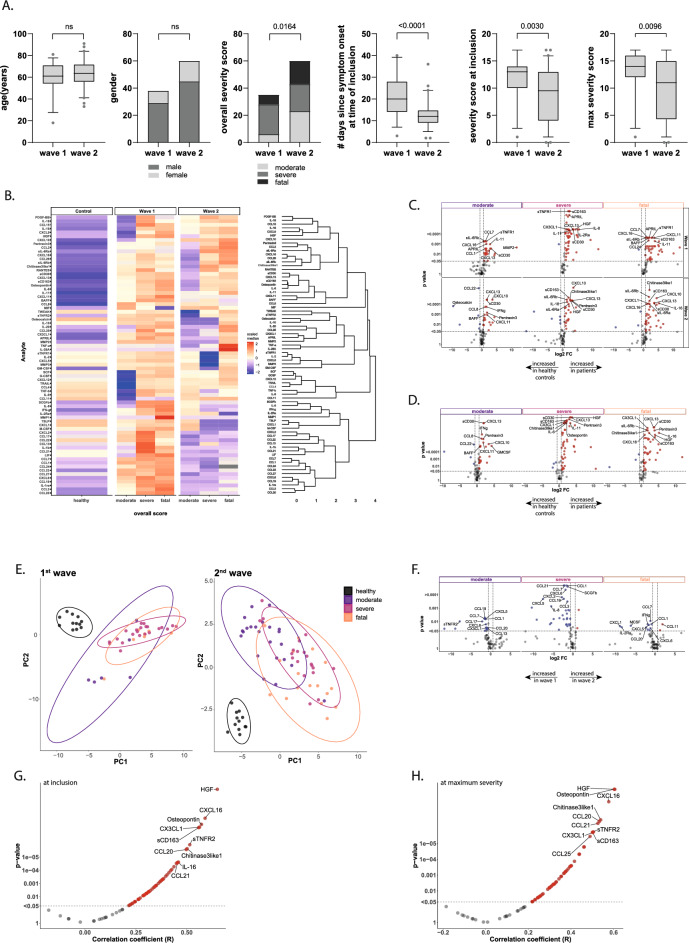
Serum analytes at hospital admission differ over outcome groups. A Descriptive characteristics of BEAT-COVID participants, 95 patients (and 12 healthy controls). Sample collection in 2 waves (1: April–August 2020; 2: August 2020–March 2021), participant characteristics are plotted for age, gender, outcome (moderate (hospital admission, no ICU), severe (ICU admission during hospitalisation) and fatal (patient deceased as result of SARS-CoV2 infection)), days since symptom onset at first time point of sample collection (= inclusion) and SCODA-severity-scores at first and maximal time points. Box and whiskers summarize the median (thick line), 25–75% percentiles (box) and 5–95% percentiles (whiskers), outliers are shown. Significant differences between groups were identified using Mann–Whitney-U-tests and for gender and overall severity score by Chi-square testing. B Heatmap of relative levels (medians) of all circulating analytes, data collected in pg/ml, + 1log2-transformed and row-scaled. Data are separated for wave-1 and 2, and outcome groups in separate columns. Complete-linkage Euclidian hierarchical clustering was performed with resulting dendograms. C Volcano plots of differences in analyte levels for moderate, severe and fatal outcome groups relative to the healthy control group, for wave-1 (top) and wave-2 (bottom). Difference was calculated using Mann–Whitney-U-test, with Benjamini-Hochberg (FDR), significant markers in red and blue. The top 10 markers were named. D Volcano plot of differences in combined data collected in wave-1 and 2. Analysis and plotting same as 1C. E PLS-DA analysis of healthy controls and 3 outcome groups (moderate, severe and fatal) for wave-1 (left) and wave-2 (right). F Volcano plots of differences in analyte levels for moderate, severe and fatal outcome groups in wave-1 vs wave-2. Analysis and plotting same as 1C, G Correlation analysis (Spearman) of analyte levels and disease severity at the first available time point for each patient with P-values on the y-axis against the correlation-coefficient on the x-axis. Significant analytes (P < 0.05, correlation-coefficient > 0.2) in red and top 10 markers named. Severity-scores were calculated on daily basis, per individual patient the time point with the highest daily severity-score was selected (if multiple days with a similar high score the first day was taken) and correlation analysis (Spearman) and plotting was performed as in 1G.

