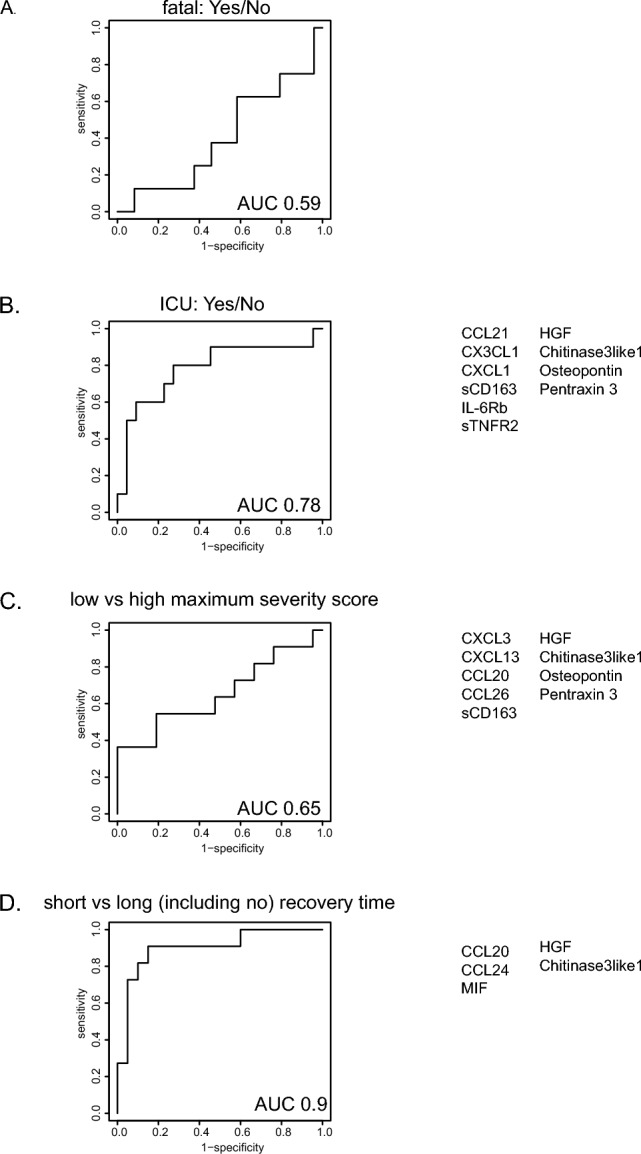
Figure 2.

Prediction of disease course at time of study inclusion. ROC curves showing the predictive power of the analyte signatures identified to predict fatal outcome (A), ICU admission (B), severity-score (C) and disease duration (D), using logistic regression with lasso regularisation and LOOCV and train (70%)-test (30%) split to assess performance. For severity-scores the cut-off was set at a value of 8 and for disease duration day 21 was used. ROC curves were generated separately for all data of both waves combined to reach sufficient power. Individuals included in generation of the predictive algorithms varied. Fatal outcome yes (n = 8) vs no (n = 24), ICU yes (n = 22) vs no (n = 10), low (n = 11) vs high (n = 21) maximal severity-score, short (n = 11) vs long (n = 20) recovery time. AUC are included in each of the ROC curves and markers included in the signatures are described next to the ROC curves for all predictions with an AUC > 0.6.
