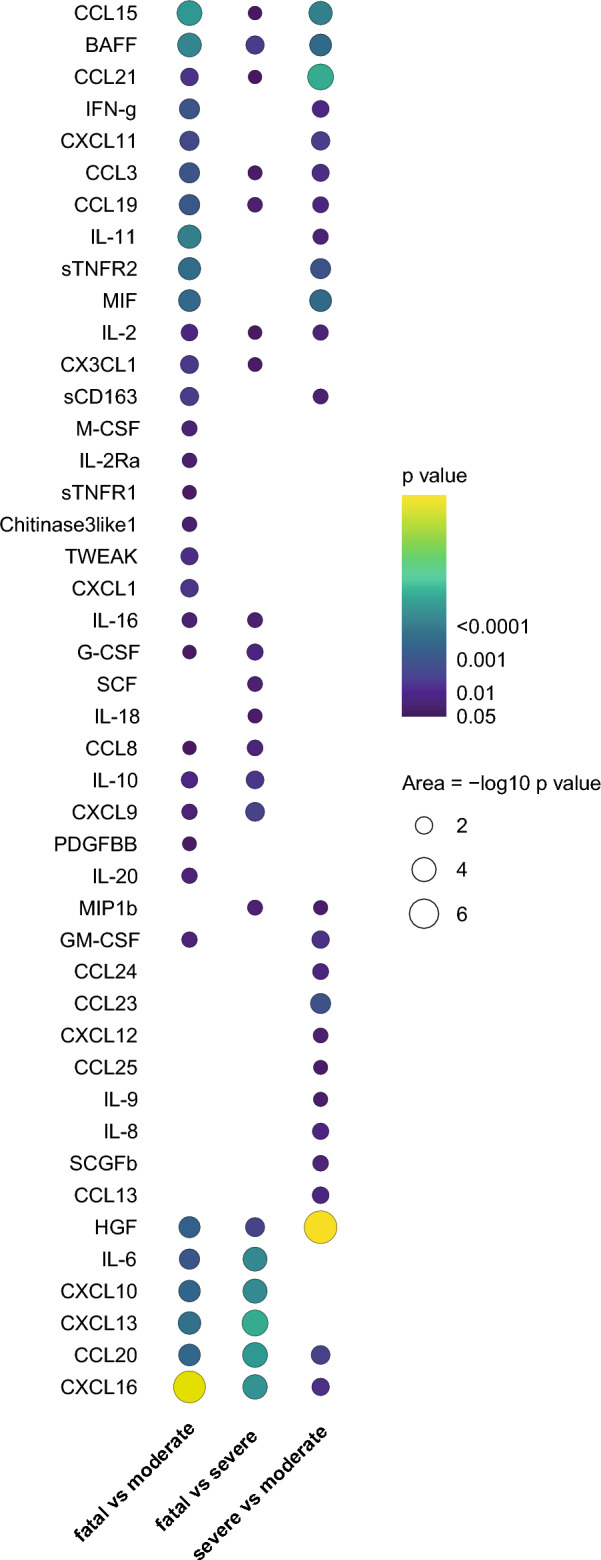
Figure 3.

Longitudinal trajectories differ between disease outcome groups. Longitudinal modelling linear mixed effects models were applied on plus one log2-transformed values of each soluble analyte separately. For each analyte the association between circulating levels and outcome categories (moderate, severe, fatal) was tested to identify different mean progressions during follow-up. Pairwise comparisons were made between moderate and severe, severe and fatal and moderate and fatal outcome groups. P-values are plotted when significant per analyte in each comparison, with dot size and colouring reflecting P-value.
