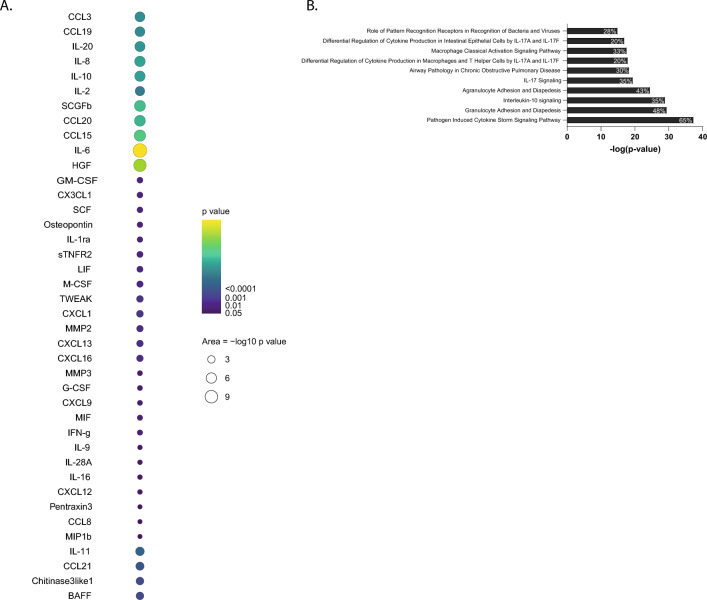
Figure 4.
Correlation of analyte levels with disease severity. A Longitudinal modelling linear mixed effects models were applied on plus one log2-transformed values of each soluble analyte separately. For each analyte the association between circulating levels and daily SCODA severity-score was tested over time to identify different mean progressions during follow up. P-values are plotted when significant per analyte, with dot size and colouring reflecting P-value. B Pathway analysis was performed in the Ingenuity platform on all analytes with a significant association between severity-scores and analyte levels longitudinally (from A) and pathways were identified that contained these analytes. The top 10 canonical pathways, based on P-values, are listed. In each bar the percentage indicates the proportion of the 40 analytes that correlated significantly and was associated with this pathway, thus 26 of 40 (= 65%) analytes are part of the ‘pathogen induced cytokine storm signaling pathway’.

