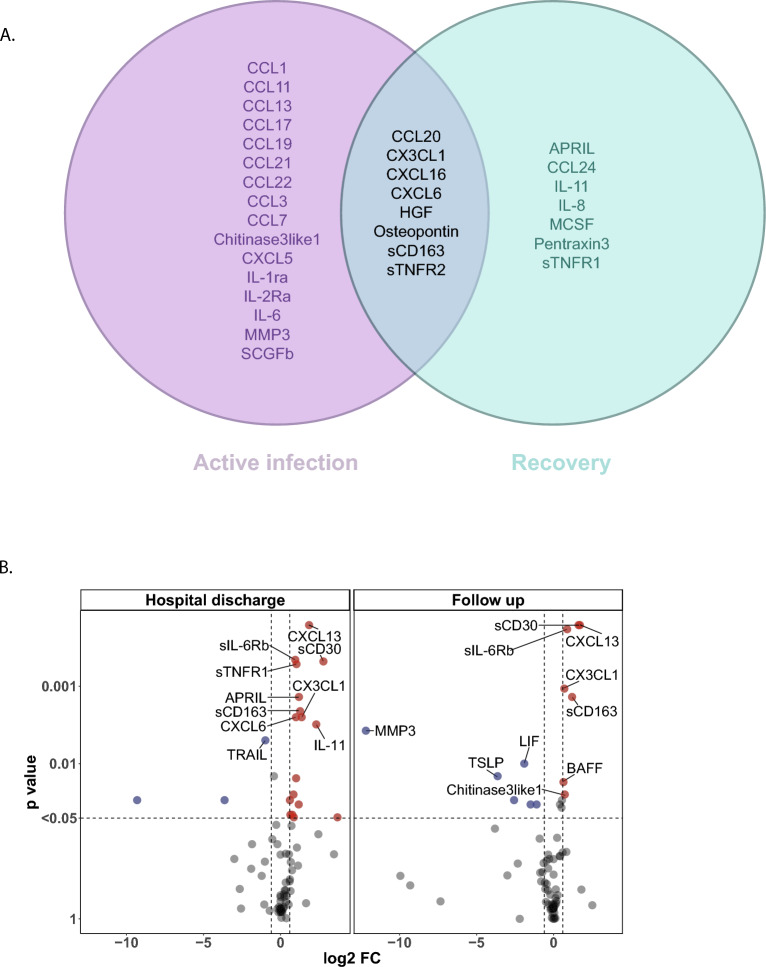
Figure 5.
Different markers associate with disease progression and recovery. A Patients were hospitalized with progressing disease, however before hospital discharge recovery was initiated. The SCODA daily severity-score allowed to dissect between progressing/ongoing disease (increasing or stable daily severity-scores) and recovery (decreasing daily severity-scores). The time point of recovery was defined as a daily severity-score of ≤ 7, with no subsequent increases. Correlation analysis (Spearman, P < 0.05) was performed on analyte levels and daily severity-scores on all time points collected before recovery (progressing/active disease) and compared to analytes correlating at all time points post recovery, but still during hospital admission. Before recovery 57 samples were analysed, after recovery 34 samples were analysed. Data are displayed as Venn diagrams with analytes uniquely correlation in active infection, analytes overlapping between active infection and recovery, and analytes uniquely correlating with severity during recovery. B Samples collected at hospital discharge as well as samples collected on an out-patient follow-up time (6–12 weeks post discharge) were compared to healthy controls. Volcano plots of differences in analyte levels for discharge and follow-up relative to the healthy control group. − log10-transformed P-values are plotted on the y-axis against log2 FC on the x-axis, analytes with P < 0.05 and log2 FC < − 0.6 or > 0.6 were labelled as significant (red and blue dots). Difference was calculated using Mann–Whitney U, with Benjamini–Hochberg as FDR method. The top 10 analytes were named.

