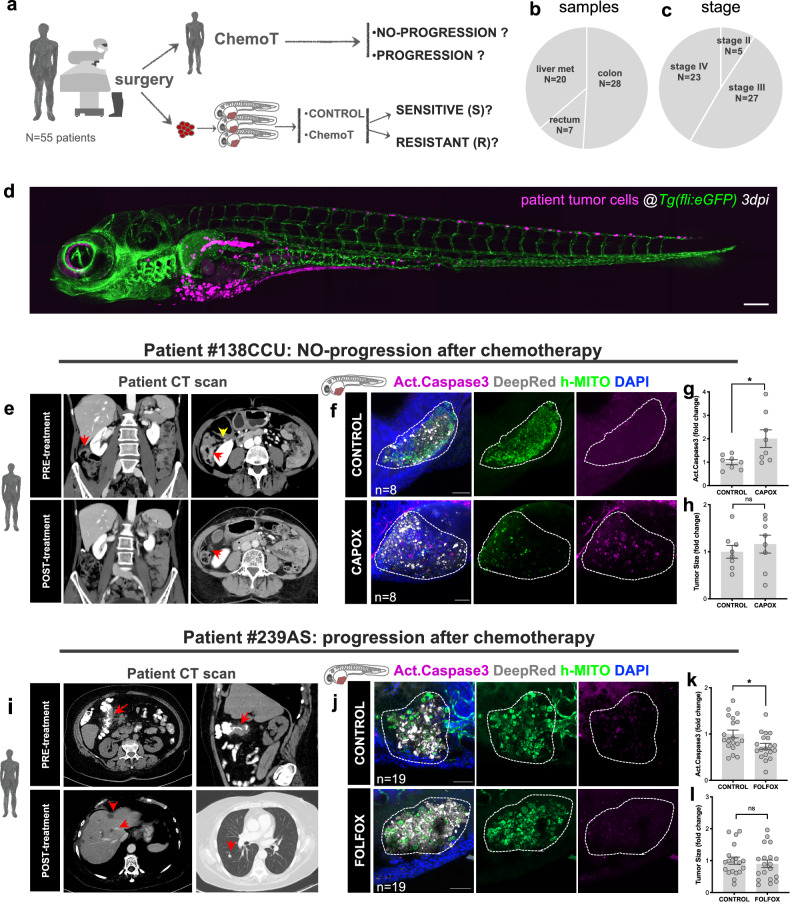
Fig. 1. Clinical study design, patient cohort and examples of zAvatars analysis.
a Design of the study: zAvatars of 55 CRC patients were generated and treated in vivo with the same therapy of the corresponding patient. Response to treatment was compared between patients and their matching zAvatar. b Type and (c) stage of CRC samples included in the study. d Representative image of a zAvatar at 3dpi. Scale bar represents 200 µm. e Axial (left image) and coronal (right image) computed tomography (CT) images from patient#138CCU showing the primary tumor (red arrows) in the hepatic flexure of the colon (yellow arrow). Post-operative follow-up imaging revealed no signs of disease recurrence, representing an example of a patient with no-progression. The red arrow indicates right hemicolectomy. f zAvatars#138CCU were generated by injecting colon cancer cells from patient #138CCU into the PVS of 2dpf zebrafish embryos. At 1dpi zAvatars underwent the same therapy as the patient (CAPOX) for 2 consecutive days and then compared to untreated controls. Quantification of apoptosis (activated caspase3) in control and treated zAvatars (g, p = 0.0281). i CT scan from patient#239AS displays irregular wall thickening of the hepatic flexure (red arrows) suggestive of colon cancer. Post-operative follow-up imaging reveals multiple hypodense lesions on liver parenchyma (left image) and a lung lesion (right image) (red arrows), thus representing an example of a patient who progressed. j zAvatar#239AS were generated by injecting colon cancer cells from patient #239AS into the PVS of 2dpf zebrafish embryos. At 1dpi zAvatars underwent the same adjuvant chemotherapy as the patient (FOLFOX) for 2 consecutive days and then compared to untreated controls. zAvatars did not show activation of apoptosis after treatment (k, p = 0.0313). In both examples, tumor cells are labeled in white (cell tracker DeepRed) and DAPI in blue. Maximum Z projections of human-mitochondria marker are shown in green and activated Caspase3 in magenta. Apoptosis (activated Caspase3) (g, k) and tumor size (h, l) were quantified at 3dpi. Results are expressed as AVG ± SEM. Each dot represents one zAvatar and the total number (n) of zAvatars analyzed is indicated in the images. A dashed white line delineates the tumor. Scale bars=50μm. Data were analyzed using unpaired two-sided Mann–Whitney test: (ns) > 0.05, *p ≦ 0.05. Source data are provided as a Source Data file.

