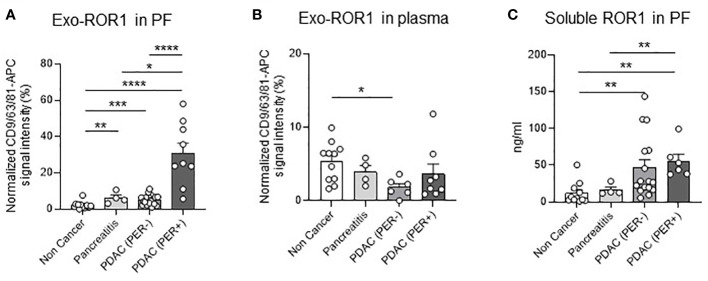
Figure 2.
Exo-ROR1 in peritoneal fluid (PF) and plasma and soluble ROR1 in PF. (A) Values of normalized CD9/63/81-APC signal intensity of exo-ROR1 (%) in PF. Non Cancer: n=15, Pancreatitis: n=4, PDAC (PER-): n=18, PDAC (PER+): n=9. *p<0.05, **p<0.01, ***p<0.001, ****p<0.0001. (B) Values of normalized CD9/63/81-APC signal intensity of exo-ROR1 (%) in plasma. Non Cancer: n=11, Pancreatitis: n=4, PDAC (PER-): n=6, PDAC (PER+): n=8. *p<0.05. (C) ELISA: Concentrations of soluble ROR1 (ng/ml) in PF. Non Cancer: n=11, Pancreatitis: n=4, PDAC (PER-): n=16, PDAC (PER+): n=6. **p<0.01.

