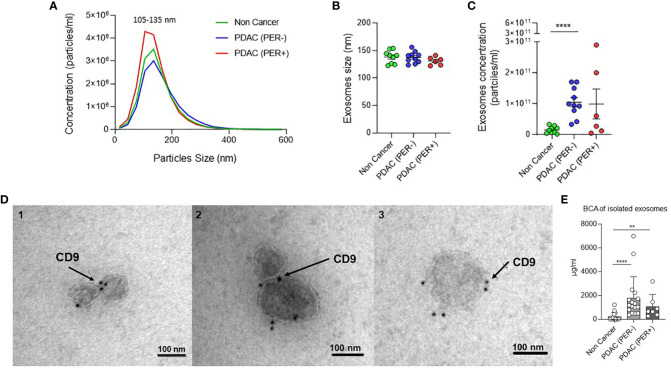
Figure 6.
Verification of exosome isolation. (A) Nanotracking Analysis (NTA): Exosome concentration and size distribution. Green: Non Cancer n=8, Blue: PDAC (PER-) n=9, Red: PDAC (PER+) n=6. (B) Nanotracking Analysis (NTA): Exosomes size distribution by ZetaView analysis showing the mode size of exosomes in 1 ml PF from Non Cancer, PDAC (PER-), and PDAC (PER+) patients. Green: Non Cancer n=8, Blue: PDAC (PER-) n=9, Red: PDAC (PER+) n=6. (C) Nanotracking Analysis (NTA): Exosome concentration by ZetaView analysis showing the number of exosomes per milliliter of PF derived from Non Cancer, PDAC (PER-), and PDAC (PER+) patients. ****p<0.0001. Green: Non Cancer n=8, Blue: PDAC (PER-) n=9, Red: PDAC (PER+) n=6. (D) Transmission Electron Microscopy (TEM) of isolated exosomes from three PF samples: 1=Non Cancer, 2=PDAC (PER-), 3=PDAC (PER+). Black dots: CD9-immunogold. (E) BCA protein concentration analysis of isolated exosomes (µg/ml): Non Cancer: n=15, PDAC (PER-): n=17, PDAC (PER+) n=7. **p<0.01.

