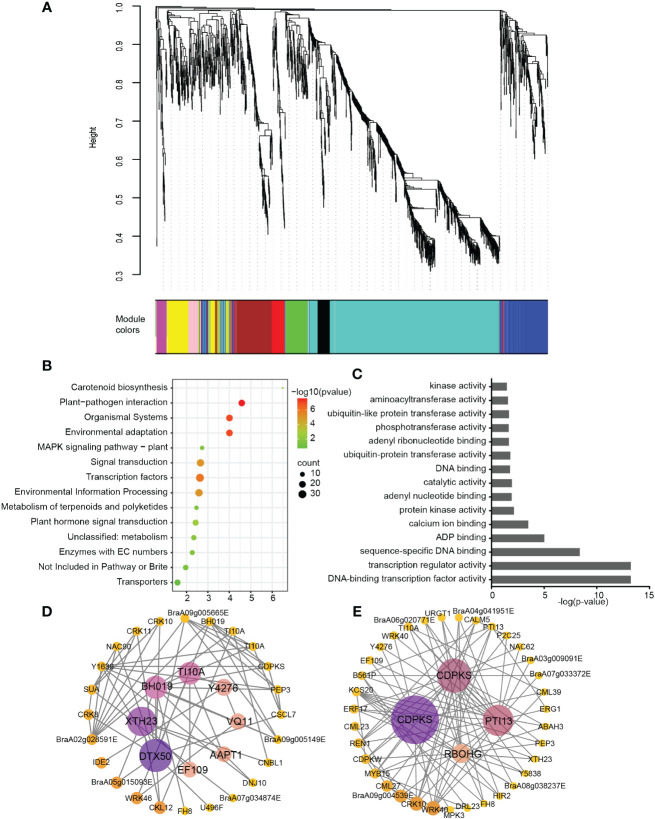
Figure 3.
Weighted gene co-expression network analysis of relative differentially expressed genes. (A) Hierarchical cluster dendrogram showed co-expression modules. Each leaf (short vertical line) in the tree represented one gene. The genes were clustered based on dissimilarity measure. The major tree branches, corresponded with the color rows below the dendrogram, constituted the modules. (B) KEGG enrichment of “turquoise” module genes. (C) GO enrichment of “turquoise” module genes. (D) Interaction network of the identified hub genes in “turquoise” module. (E) Interaction network of “Plant-pathogen interaction” in “turquoise” module.

