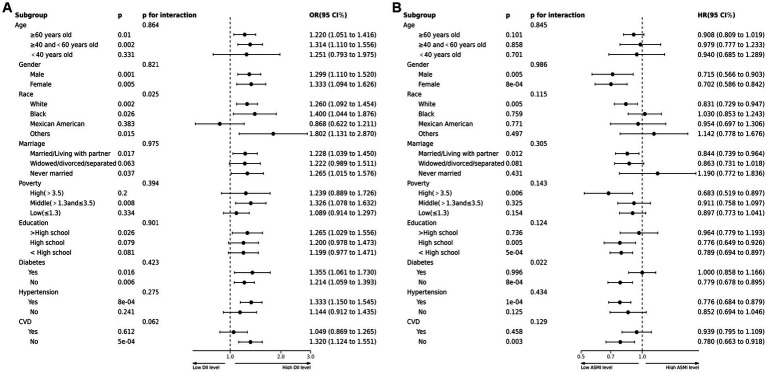
Figure 3.
(A) Forest plots of stratified analyses of DII and sarcopenia in COPD. Age, gender, race, marriage, poverty, education and history of hypertension, CVD or diabetes were all adjusted except the variable itself. (B) Forest plots of stratified analyses of sarcopenia and all-cause mortality. Age, gender, race, marriage, poverty, education and history of hypertension, CVD or diabetes were all adjusted except the variable itself.

