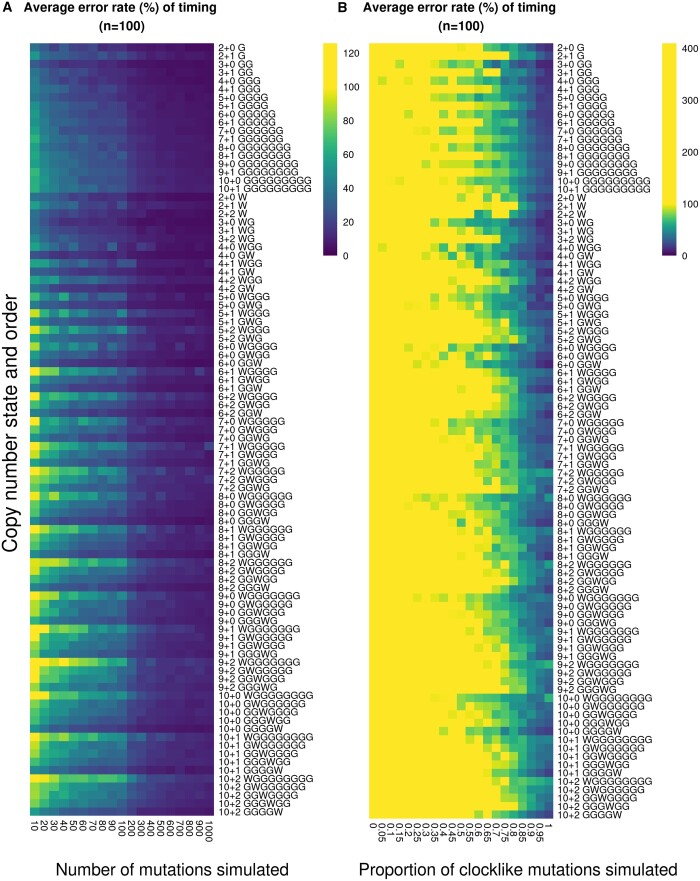
Figure 3.
Average error rate of time points calculated from simulated data, expressed as a percentage. n = 100 randomly simulated sets of time points for each order, copy number state, and condition. Colour scales are capped at 100% error rate to allow better visualization of lower percentages. (A) Average error rate of calculated time points when varying the number of simulated mutations. (B) Average error rate of calculated time points when varying the proportion of clock-like mutations simulated.

