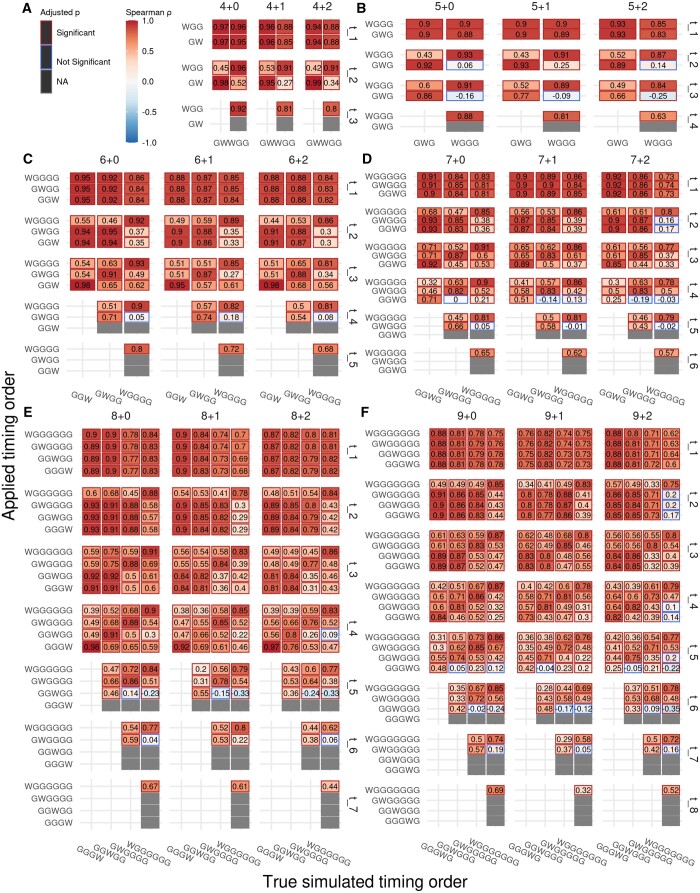
Figure 4.
Spearman correlation between the simulated and calculated time for each time point when timed using all possible equations and event orders for timeable copy number states from 4 + 0 to 9 + 2 (A–F). Results for 10 + 0, 10 + 1, and 10 + 2 are shown in Supplementary Fig. S3. The trailing diagonal represents the correlation between time points calculated using the same order of events from which the data were simulated. n = 100 randomly simulated sets of time points for each order from which a set of 100 mutations was simulated for timing. Cell colours and numbers indicate the Spearman . Cell borders indicate Benjamini–Hochberg adjusted P-values relative to an of 0.05. Grey cells and cell borders indicate comparisons for which correlation could not be calculated due to differences in the number of time points available.

