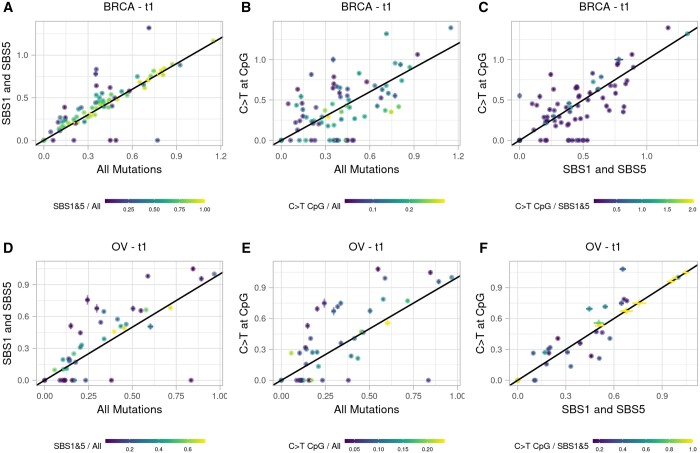
Figure 6.
Comparison of timing estimates obtained using different mutation types for initial MYC gains or WGDs in BRCA (A–C) and OV (D–F) samples. The colour scheme indicates the ratio of the number of mutations used for each timing estimate (y/x). The mean difference in timing estimates and the results of paired Wilcoxon Rank Sum tests are listed in Supplementary Table S5 for each comparison.

