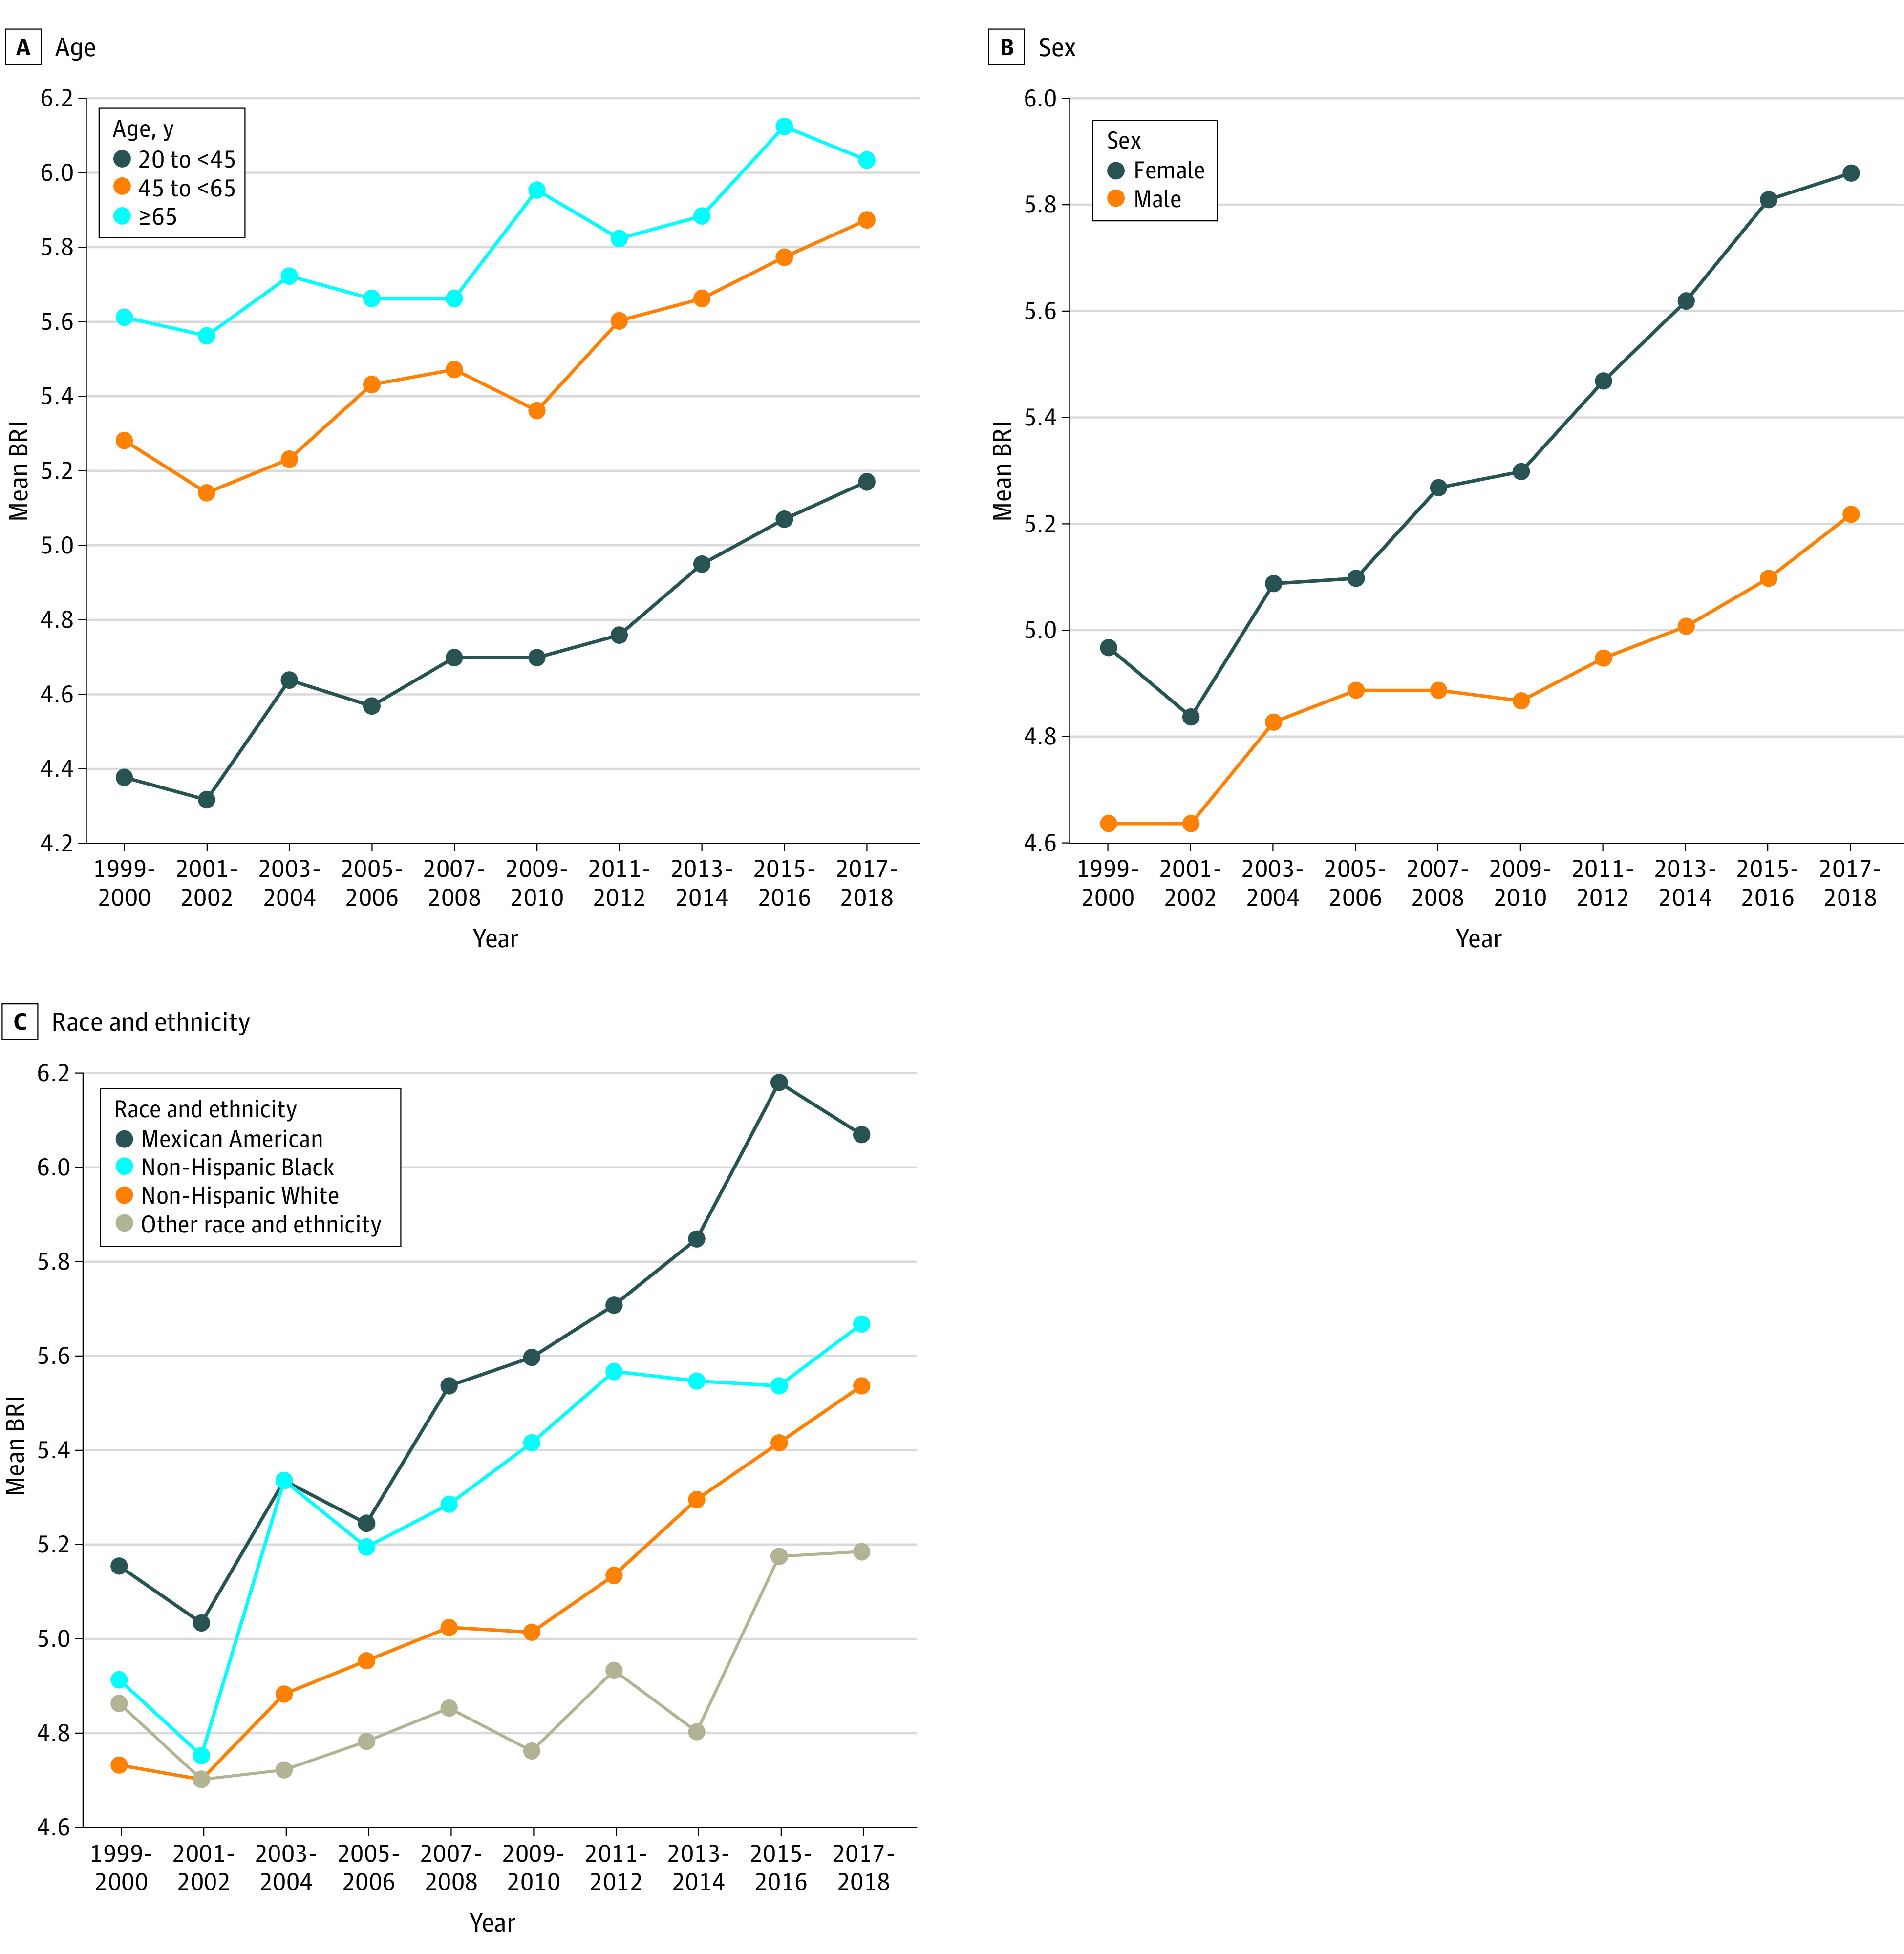
Figure 1. Trends of Mean BRI Values by Age, Sex, and Race and Ethnicity in US Adults.

Nationally representative estimates of the nonpregnant US population aged 20 years or older. Estimates were nationally representative through the use of survey weights from the National Health and Nutrition Examination Survey. Race and ethnicity were based on self-report in closed categories, and other race and ethnicity included American Indian or Alaska Native, and Native Hawaiian or Pacific Islander, and non-Hispanic Asian. BRI indicates body roundness index.
