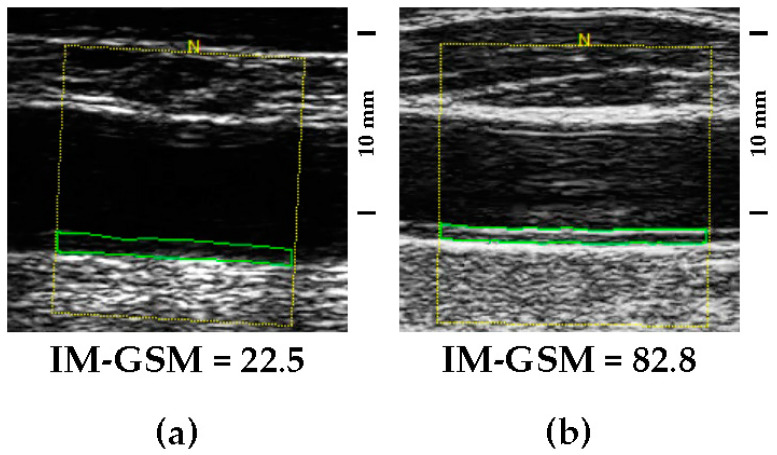
Figure 1.
(a) Didactic example of an echolucent intima–media complex (low IM-GSM). (b) Didactic example of an echogenic intima–media complex (high IM-GSM). Both images were detected in the 2nd cm of two common carotid arteries visualized by using the same ultrasonographic gain setting. Images reported are the most representative, and were chosen from a shortlist of about 10 random images. The yellow frame identifies the region of interest, while the green frame identifies the intima-media complex.

