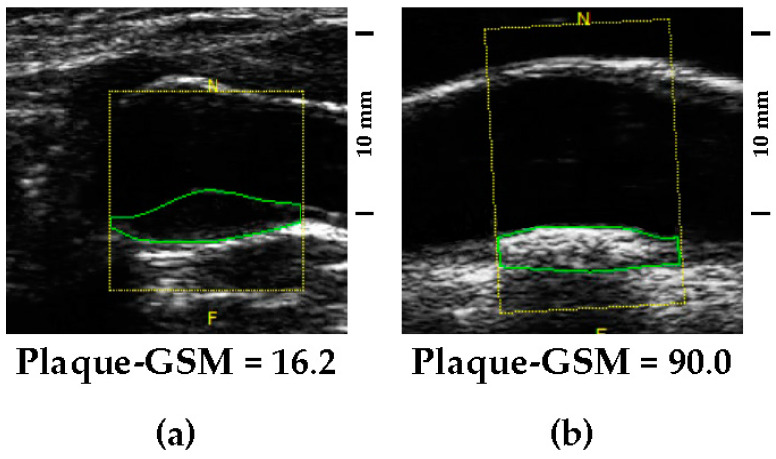
Figure 2.
(a) Didactic example of an echolucent plaque (low plaque-GSM). (b) Didactic example of an echogenic plaque (high plaque-GSM). Both images were detected in carotid arteries visualized by using the same gain setting. Images reported are the most representative, chosen from a shortlist of about 10 random images. The yellow frame identifies the region of interest, while the green frame identifies the atherosclerotic lesion.

