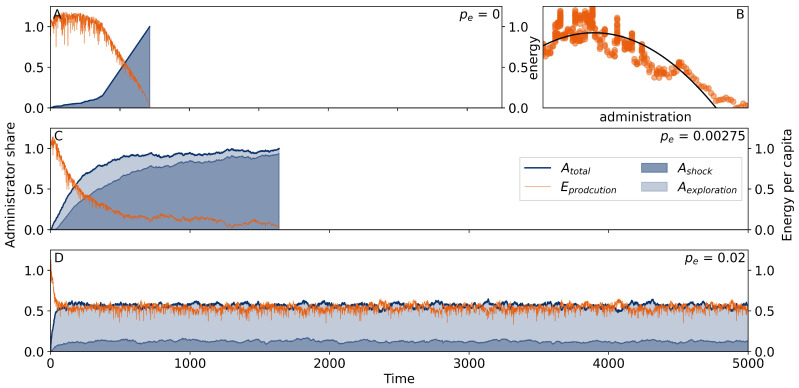
Figure 2.
Exemplary network simulations of a Tainter-like model society ( ) according to the model description. The panels show only the first 5000 time steps to focus on the initial dynamic. Blue curves show the share of the administration in the network (light blue: administration as a result of decreased resource availability; dark blue: administration resulting from exploration with rate ). Orange curves show the average energy produced per node. (A) shows the typical development of a network reacting to shocks by changing one node from coordinated laborer C to administrator A. (B) displays a moving average of the energy measured in (A) against the size of the administration. The black curve indicates stylized parabola-shaped diminishing marginal returns as in [18]. (C) displays the network development at an intermediate exploration probability ( . (D) shows the development of a network with a high probability of exploration ( ).

