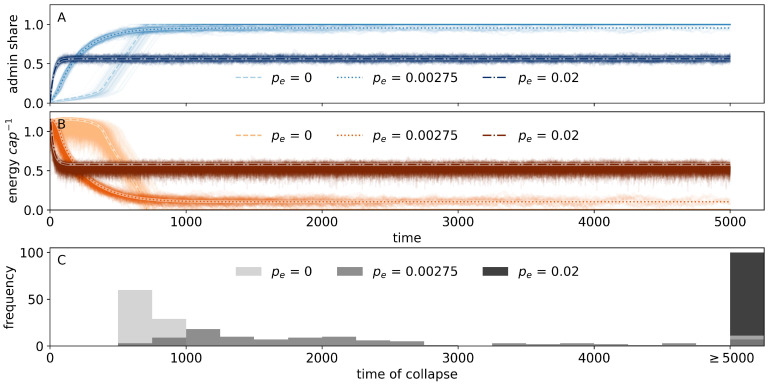
Figure 3.
Analytic approximation of the model dynamics with the share of administration (A) and corresponding energy production per capita (B). Transparent solid lines show the results of an ensemble of 100 simulations of the microscopic network model for different values of . Dashed lines display the respective analytical approximation. (C) Histograms of collapse frequencies of the model, i.e., frequency of times at which energy production approaches zeros, . Bars located at time show right-censored cases of the simulation.

