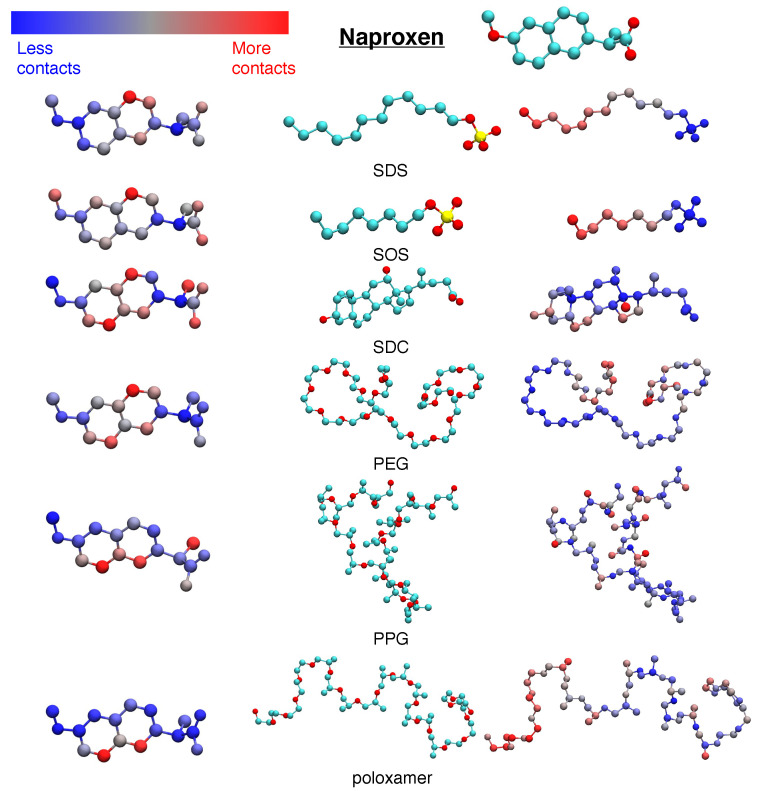
Figure 2.
Heavy atom contact maps for where naproxen molecules come in contact with excipient molecules. For each excipient, we show a naproxen structure colored by the contact map (left), a structure of the excipient colored by atom type (middle), and a structure of the excipient colored by the contact map (right). For structures colored by atom type, the color mapping is C–cyan, O–red, and S–yellow. For structures colored by the contact map, red regions represent where the drug and excipient are in contact the most, while blue regions represent where the drug and excipient are in contact the least.

