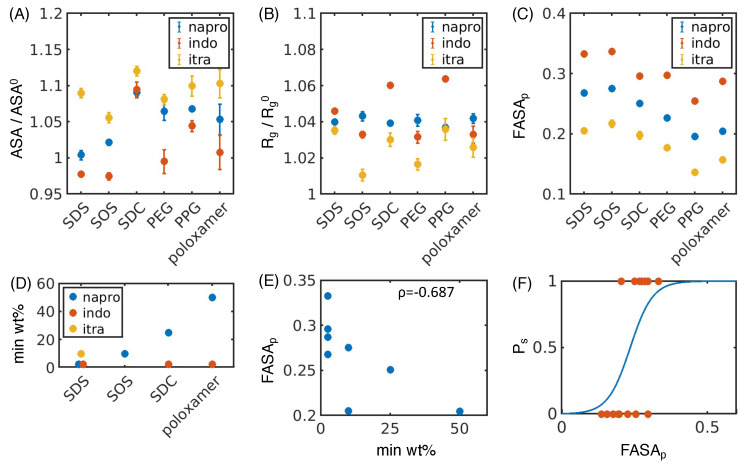
Figure 4.
Utilizing surface descriptors to predict nanosuspension stability. (A) Accessible surface area of the excipient–drug system (ASA) divided by the accessible surface area of the drug crystal without excipients (ASA0) for naproxen (napro, blue), indomethacin (indo, orange), and itraconazole (itra, yellow), with all excipients tested. (B) Radius of gyration of the excipient–drug system ( ) divided by the radius of gyration of the drug crystal without excipients ( ) for all drug–excipient combinations. (C) Fraction of polar surface area (FASAp) for all drug–excipient combinations. (A–C) Error bars represent the standard deviation of estimates from five independent time windows. (D) Minimum weight percentage of excipient needed to form a stable nanosuspension (min wt.%) for each system that forms a stable nanosuspension. Data taken from Table S1 and Ferrar 2020 [39] and are listed explicitly in Table S3. (E) Fraction of polar surface area (FASAp) plotted against the minimum weight percentage of excipient needed to form a stable nanosuspension (min wt.%) for each drug–excipient pair. The Pearson correlation coefficient ( ) between FASAp and min wt.% is also shown. (F) Using FASAp to predict the probability that a stable nanosuspension is formed ( ) for each drug–excipient pair using a logistic regression. True data (orange dots) and the resulting fit (blue line) are both shown.

