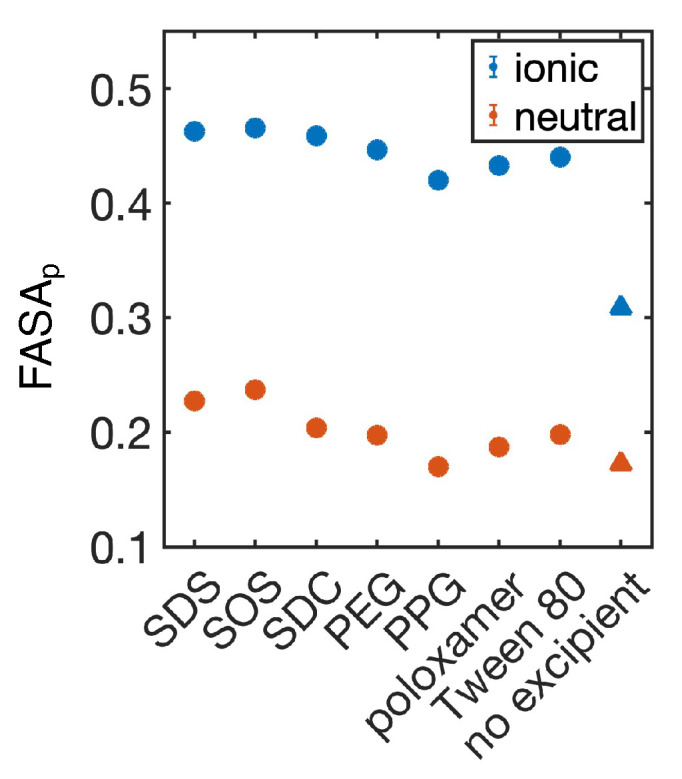
Figure 6.

Fraction of polar surface area (FASAp) for GDC-0810–excipient combinations. Ionic crystals of GDC-0810 (ionic, blue) are compared to the neutral crystals (neutral, orange). Circles indicate MD simulations with various excipients, while triangles indicate a single measurement on the crystal structure without excipients. Error bars represent the standard deviation of estimates from five independent time windows, are smaller than the symbols when not visible, and are only available from MD simulations.
