Figure 8.

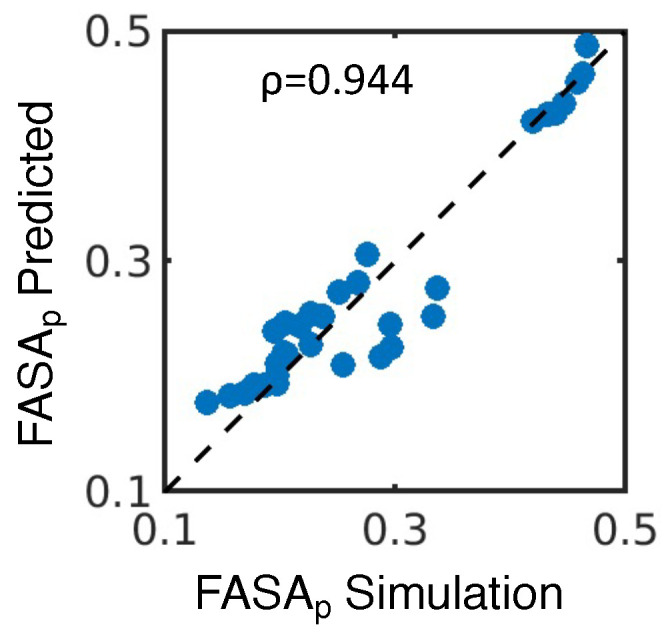
Predicting the FASAp from 2-D molecular properties. Predicted values of FASAp are compared to those from the simulation, with representing the Pearson correlation between the two datasets.

Predicting the FASAp from 2-D molecular properties. Predicted values of FASAp are compared to those from the simulation, with representing the Pearson correlation between the two datasets.