
Figure 9.
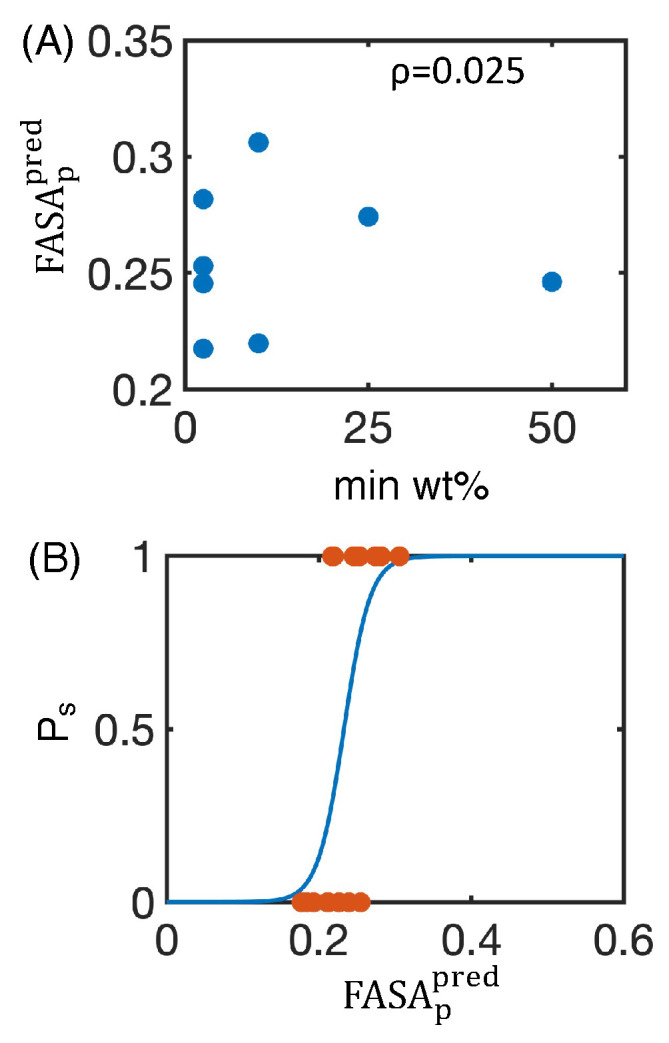
Determining nanoparticle stability using the the fraction of polar surface area predicted from two-dimensional properties ( ). (A) plotted against the minimum weight percentage of excipient needed to form a stable nanosuspension (min wt.%). The Pearson correlation coefficient ( ) between and min wt.% is also shown. (B) Using to predict the probability that a stable nanosuspension is formed ( ) using a logistic regression. True data (orange dots) and the resulting fit (blue line) are both shown.