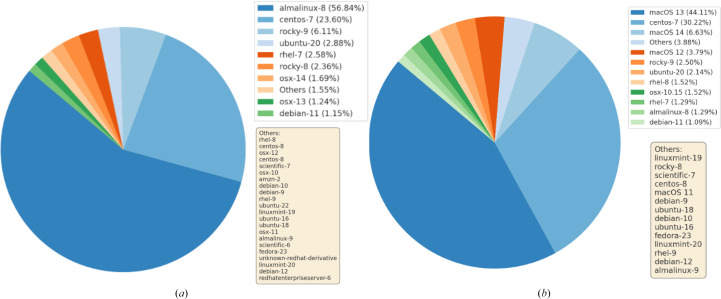
Figure 6.
Capsules logging of local and global application usage. The composite figure of two pie charts illustrates the distribution of host operating systems running SBGrid jobs in January 2024 on on-premises and cloud-based computers supporting the SBGrid Consortium laboratories. It shows operating systems with shares over 1% and an aggregate ‘Others’ category that accounts for operating systems each under 1%. (a) The pie chart illustrates the percentage of user-hosting operating systems, filtered by unique hosts, running approximately four million SBGrid jobs in January 2024. (b) The pie chart shows OS usage by jobs running a molecular-visualization application in January 2024. The log analytics reveal that more users run the molecular-visualization application on Mac than on Linux. Notably, CentOS-7 maintains the second-largest share in both (a) and (b) despite its declining usage following the announcement that it will reach end of life (EOL) in June 2024, reflecting its prior prominence in high-performance computing and scientific computing environments due to its long-term stability.

