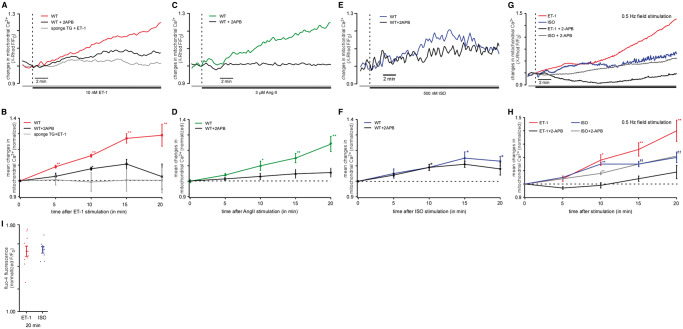
Figure 1.
Mitochondrial Ca 2+ is increased by IP 3 R agonists. ( A ) Original confocal recordings obtained from WT and transgenic (sponge) myocytes stimulated with 10 nM ET-1 ± 3 µM 2-APB (red: WT, ET-1 alone; black: WT, ET-1 + 2-APB; grey: TG, ET-1 alone) for 20 min. ( B ) Mean values of resulting mitochondrial Ca 2+ (Ca 2 +m ) changes induced by ET-1 in WT mice in the absence ( n = 27 from seven animals) or presence of 2-APB ( n = 19 from four animals) and in IP 3 sponge mice [colours same as in ( A )]. ( C ) Original confocal recordings of myocytes stimulated with 3 µM Ang II ± 3 µM 2-APB (green: Ang II; black: Ang II + 2-APB). ( D ) Mean values of resulting Ca 2 +m changes induced by Ang II in the absence ( n = 10 from three animals) or presence of 2-APB ( n = 5 from two animals) [colours same as in ( C )]. Both IP 3 agonists evoked a significant increase in Ca 2 +m , respectively. This increase could be blocked effectively by 3 µM of the IP 3 receptor blocker 2-APB and was abolished in IP 3 -sponge mice. ( E ) Original confocal recordings of WT and transgenic (sponge) myocytes stimulated with 500 nM ISO ± 3µM 2-APB (blue: WT, ISO alone; black: WT, ISO + 2-APB) for 20 min. ( F ) Mean values of Ca 2 +m changes induced by ISO in the absence ( n = 10 from three animals) or presence of 2-APB ( n = 8 from two animals) [colours same as in ( E )]. The smaller peak and different time course indicate different underlying mechanisms. ( G ) Original confocal recordings obtained from electrically stimulated (0.5 Hz) WT myocytes stimulated with 10 nM ET-1 ± 3 µM 2-APB (red: ET-1 alone; black: ET-1 + 2-APB) or ISO ± 3 µM 2-APB (blue: ISO alone; grey: ISO + 2APB) for 20 min. ( H ) Mean values of resulting mitochondrial Ca 2+ (Ca 2 +m ) changes induced by ET-1 and ISO in WT mice in the absence (ET-1: n = 6 from three animals; ISO: n = 7 from two animals) or presence of 2-APB (ET-1 + 2-APB: n = 5 from three animals; ISO + 2-APB: n = 11 from two animals) [colours same as in ( G )]. ( I ) Mean values of cytosolic Ca 2+ levels (Ca 2 +i ) in mouse myocytes measured with the Ca 2+ -sensitive probe fluo-4. The myocytes were stimulated with ET-1 (red) or ISO (blue), respectively, demonstrating that both agonists induced a stable increase of Ca 2 +i . * P < 0.05 compared with untreated control using ANOVA Dunnett’s test; ** P < 0.01 compared with untreated control ANOVA Dunnett’s test.

