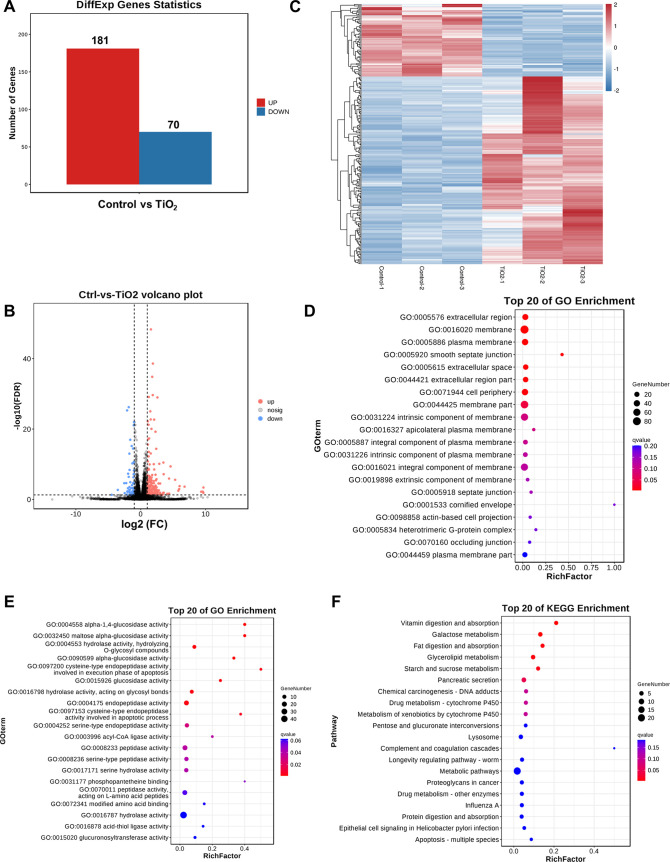
Figure 4.
Transcriptional network of TiO2 NP exposure in Drosophila testes. (A) Statistics of DEGs between the control and TiO2 NP (1.8 mg/mL) groups. (B) Volcano plot based on −log 10(FDR) and log2(FC) from the comparison of control and TiO2 NP (1.8 mg/mL) groups. (C) Clustering heatmap of DEGs for the comparison between the control and TiO2 NP (1.8 mg/mL) groups. (D, E) Top 20 of GO enrichment of cellular components (D) and molecular function (E) for DEGs between the control and TiO2 NP (1.8 mg/mL) groups. (F) KEGG enrichment analysis of DEGs between the control and TiO2 NP (1.8 mg/mL) groups.

