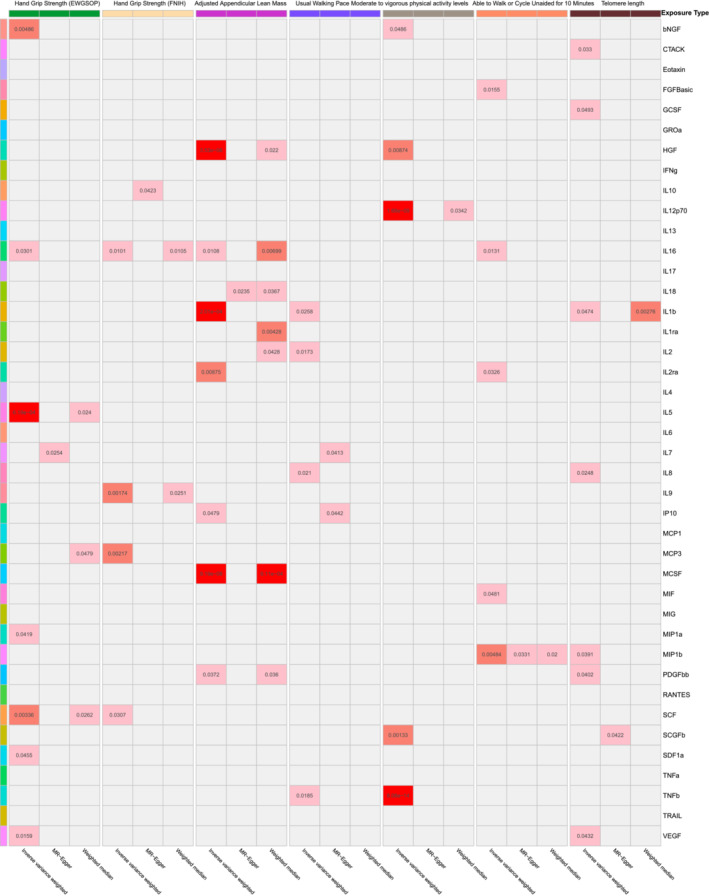
Figure 3.

Heatmap of the causal associations of cytokines and growth factors with sarcopenia and aging traits in Analysis B. The grey cells represent no significant association, and the depth of the red cell means the P‐value. A deeper cell means a smaller P‐value.
