
Figure 3.
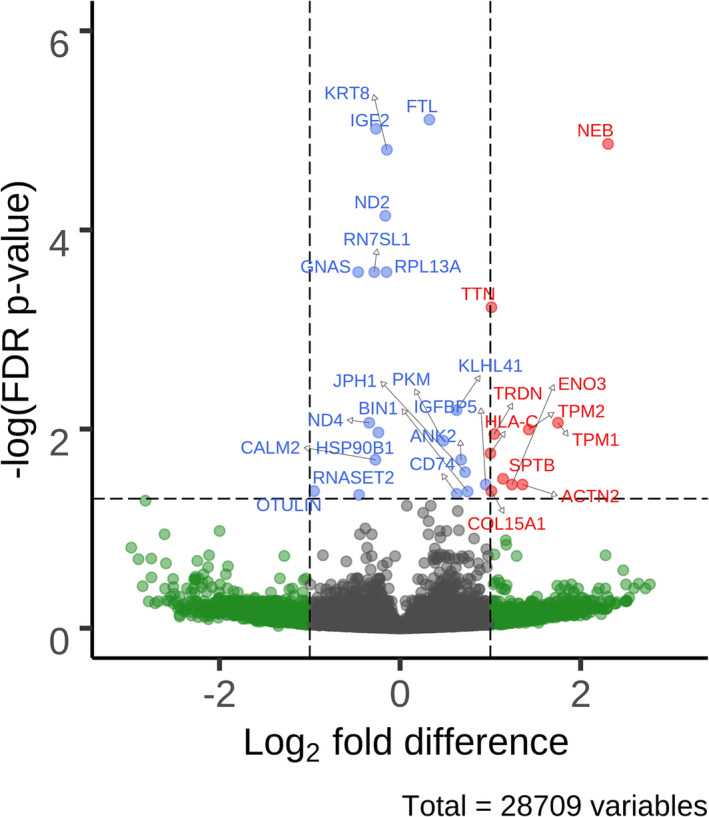
Volcano plot of differentially expressed transcripts in participants with chronic obstructive pulmonary disease associated with the presence of our sex‐stratified abnormal myofibre proportion phenotype. Labelled dots are significant after false discovery rate (FDR) correction, and labels are their respective gene names. Red dots represent transcripts with an FDR‐corrected P value <0.05 and an absolute log fold difference (FD) ≥1. Blue dots represent transcripts with an FDR P value of <0.05. Green dots represent transcripts with an absolute log FD ≥ 1.