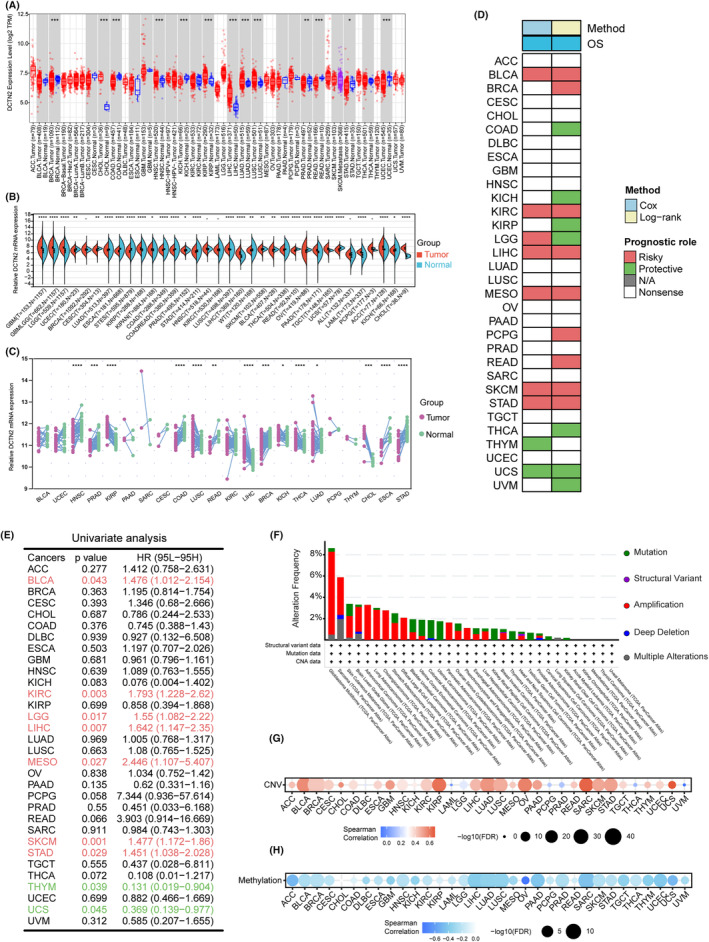
FIGURE 1.

DCTN2 expression pattern in human tumour tissues and normal tissues. (A) Boxplot showing the mRNA expression levels of DCTN2 in normal and cancer tissues using data from the TIMER database based on TCGA data. (B) Violin plot illustrating the mRNA expression levels of DCTN2 in normal and tumour tissues using data from the Sangerbox database based on TCGA>EX data. (C) DCTN2 mRNA expression in paired tumour and adjacent non‐tumour tissues based on TCGA data. (D) Heatmap showing the correlation between DCTN2 expression levels and overall survival (OS). (E) Univariate analysis demonstrating the prognostic value of DCTN2 in various tumours. (F) The somatic mutation of DCTN2 in various type of cancers. (G, H) Dotplot showing the correlation of DCTN2 with CNV or DNA methylation. *p < 0.05, **p < 0.01, ***p < 0.001, ****p < 0.0001.
