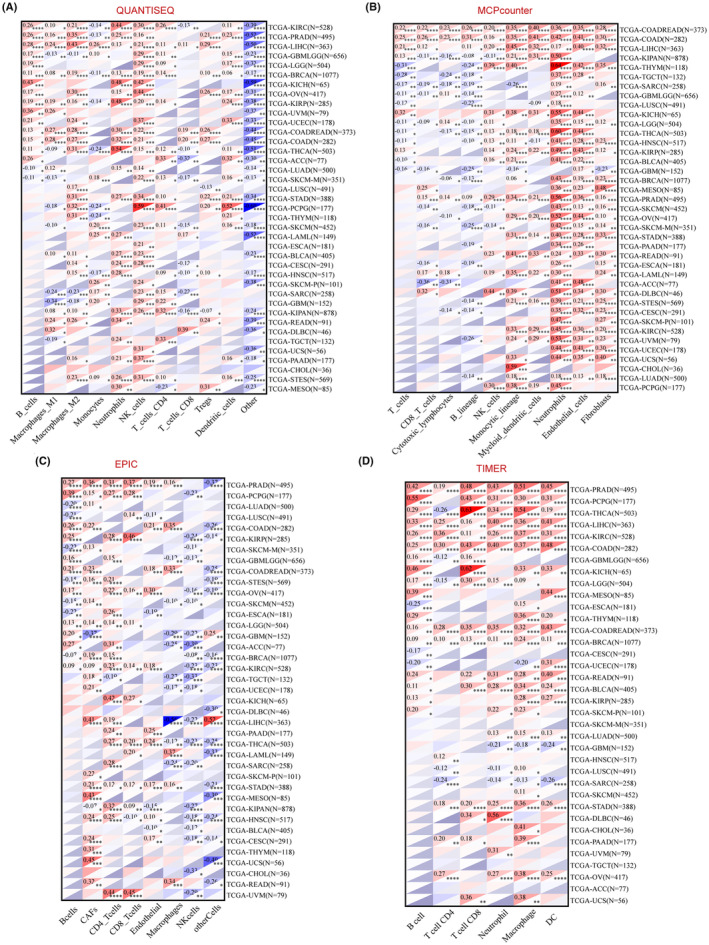
FIGURE 3.

Correlation analysis between DCTN2 expression and immune cell infiltration. (A–D) heatmaps display the correlation between DCTN2 expressions and the degree of infiltration of various immune cells by four different kinds of analysis methods.*p < 0.05, **p < 0.01, ***p < 0.001, ****p < 0.0001.
