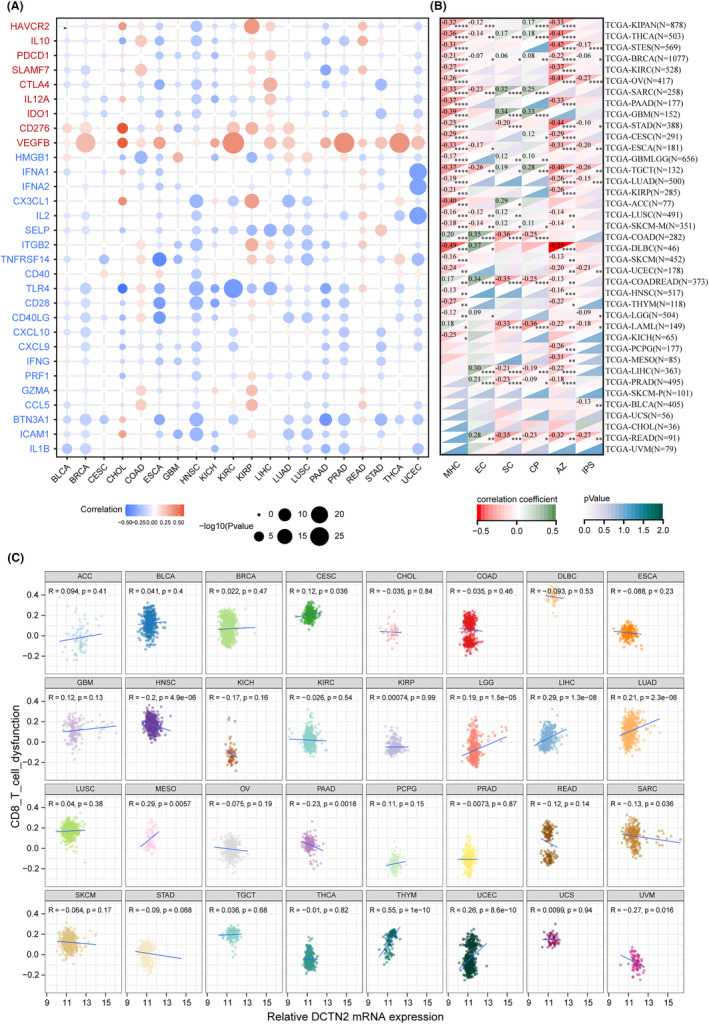
FIGURE 4.

Correlation analysis between DCTN2 expression and immune checkpoints. (A) Dotplot displays the association between DCTN2 and immunoregulators. Gene names in red represent inhibitors and those in blue indicate stimulators (B) Heatmap showing the correlation of DCTN2 with MHC score and IPS score, etc. (C) Scatter plots showing the correlation between DCTN2 expression and CD8 T cell dysfunction score.*p < 0.05, **p < 0.01, ***p < 0.001, ****p < 0.0001.
