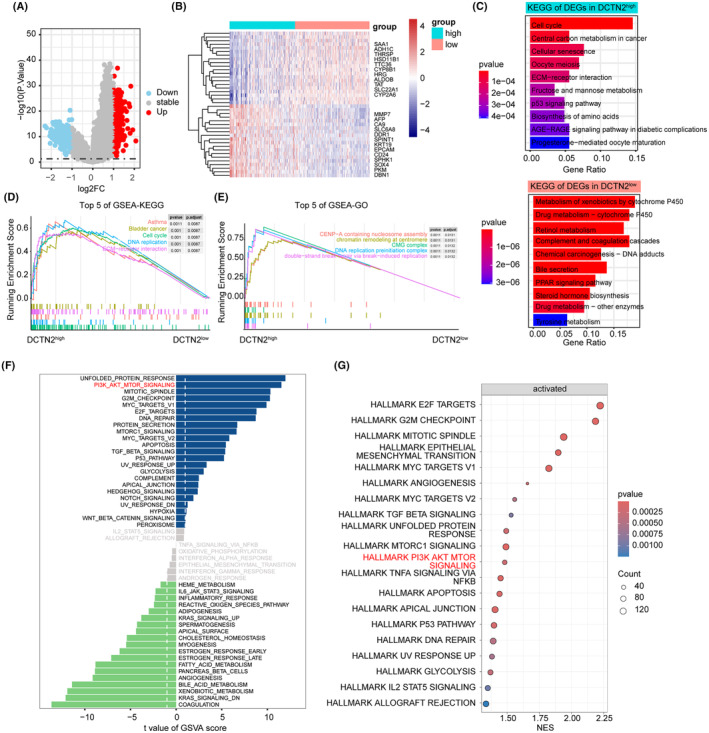
FIGURE 7.

Potential function analysis of DCTN2 in HCC. (A) Volcano plot showing the differential expressed genes (DEGs) in DCTN2 high and low groups. (B) Heatmap displayed the top DEGs in DCTN2 high or low group. (C) Barplot illustrating pathways enrichment in DCTN2 high or low group. (D, E) The top 5 pathways enriched by GSEA‐KEGG and GSEA‐GO analysis. (F, G) Hallmarker analysis by GSVA and GSEA showing AKT pathway was significantly enriched in DCTN2 high group.
