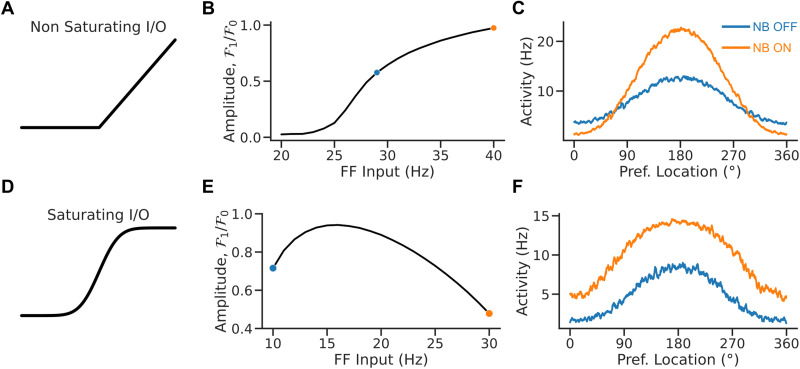
Figure 2.
Rate saturation accounts for the broadening of tuning following NB stimulation. A, Nonsaturating I/O function. B, Relative bump amplitude (i.e., the ratio of Fourier modes F1/F0 of the population rate vector; see Materials and Methods) versus the strength of the FF input. Tuning sharpens with stronger FF inputs. C, Population tuning curve for NB ON and NB OFF conditions (matching colors in B). D, Saturating I/O function (saturation occurs at ). E, Relative bump amplitude versus FF input. Tuning broadens with stronger FF input values. F, Population tuning curve for NB ON and NB OFF conditions (matching colors in E).

