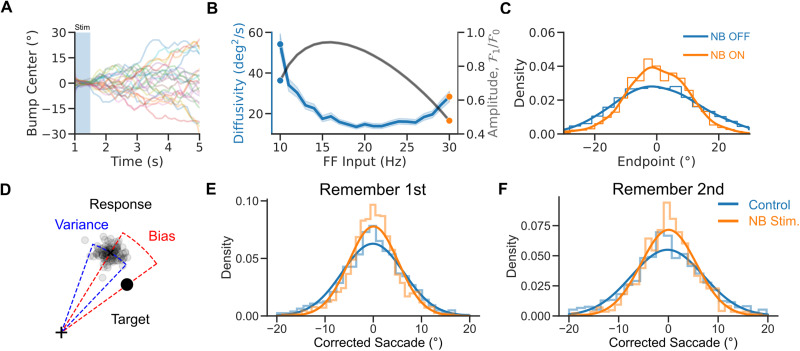
Figure 3.
A diffusion process underlies NB stimulation-induced improved performance. A, Bump center versus time for 50 network initializations (for a cue presented at 0°). The bump center follows a random walk. B, Diffusivity versus FF input. Diffusion decreases for strong enough FF inputs. Shaded area: bootstrapped 95% confidence intervals. Gray line, relative bump amplitude (see Materials and Methods). C, Distributions of bump centers’ endpoint location for two different values of the FF input (for 1,000 initial conditions). Lines are kernel density estimates. D, Two sources of errors in the experimental data: response bias and response variance. E, F. Distributions of saccades (i.e., mean corrected saccadic endpoint; see Materials and Methods) in Remember first and Remember second trials in the data. NB stimulation leads to a sharper distribution of endpoints (see regression analysis, Materials and Methods). Line are Gaussian fits. Blue: control. Orange: NB-stimulated trial.

