

Abstract
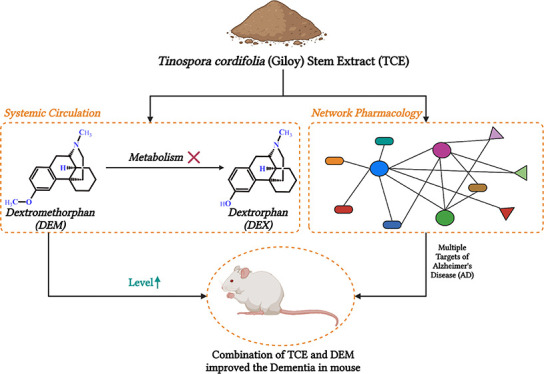
Tinospora cordifolia (Willd.) Miers (Menispermaceae) is a traditional rejuvenator and a conventional medicine used to manage oxidative stress-related diseases, including those associated with the central nervous system. Decreased dextromethorphan (DEM) metabolism is necessary for high bioavailability and application against Alzheimer’s disease (AD). Since T. cordifolia stem extract (TCE) can potentially inhibit several metabolic enzymes, it can also enhance dextromethorphan bioavailability. This study investigates the potential of TCE to improve DEM’s bioavailability and efficacy for the management of AD. In silico analysis was carried out to find the inhibition potential of phytocomponents of T. cordifolia for CYP2D6 and CYP3A4. The LC-MS method was revalidated for the analysis of DEM and metabolite dextrorphan (DEX) in the presence of quinidine (QN). The ratio of DEM to DEX was estimated with varying doses of TCE following pharmacokinetic analysis. Network pharmacology analysis was carried out to understand the complementary potential of phytocomponents. This was further validated in the scopolamine-induced dementia model through behavioral and histopathological analyses. TCE (100 mg/kg) for 14 days increased the DEM to DEX ratio by 2.8-fold compared to QN treatment. While Tmax was comparable to that of QN treatment at this dose (100 mg/kg) of TCE, it increased significantly at the higher dose (400 mg/kg) of TCE pretreatment. All other pharmacokinetic parameters were also enhanced at this dose with a 4.7-fold increase in DEM/DEX compared with QN. Network pharmacology analysis indicated the ability of TCE to target multiple factors associated with AD. Furthermore, it improved spatial memory and reduced hyperactivity in rodents better than the combination of QN and DEM.
1. Introduction
Dextromethorphan (DEM, Figure S1) suppresses cough through the modulation of the cough center. Besides interacting with multiple receptors in the central nervous system (CNS), it also blocks N-methyl-d-aspartate receptors (NMDARs).1 The NMDAR mediates excitatory glutamatergic neurotransmission for maintaining synaptic plasticity and neuron survival. However, hyper-NMDAR activity leads to hyper excitotoxicity and is a significant cause of neurodegeneration and AD.2 Thus, DEM has caught attention for repurposing against AD. However, the bioavailability of DEM is poor and variable.3 This is attributed to its rapid first-pass metabolism and subsequent elimination. DEM is primarily metabolized to dextrorphan (DEX). Although DEX is a potent blocker of NMDAR, it has poor brain access. This is because 98% of DEX is rapidly glucuronidated; in this form, it is permanently charged, limiting its BBB permeability.4 Furthermore, this promotes rapid kidney clearance, affecting the bioavailability. Nonetheless, good correlations have been reported between the plasma levels of the unbound DEX and DEM with the extracellular fluid of the brain.5,6 Thus, ensuring a higher plasma level of DEM through inhibition of its metabolism has been used as a strategy to enhance its effectiveness against neurodegeneration.7 Cytochrome P450 2D6 (CYP2D6) is responsible for 80% of the metabolism of DEM to DEX.8 Since quinidine (QN) is known to inhibit CYP2D6, its combination with DEM has been used as a therapeutic strategy to manage AD (Figure S1).9 Although QN is well tolerated at low doses, it is associated with QT prolongation and, in some cases, pleomorphic arrhythmia.10
DEM is also partly metabolized to 3-methoxymorphinan, and cytochrome P450 3A4 (CYP3A4) accounts for 90% of this metabolism.11 Since the content of CYP3A4 in the liver of an individual is generally much higher than that of CYP2D6,11 it is also desirable to inhibit CYP3A4 to increase the plasma level of DEM. However, QN itself is eliminated by CYP3A4-mediated hepatic metabolism.12 Thus, there is a scope for an alternative strategy to increase the bioavailability of DEM.
Tinospora cordifolia (Willd.) Miers (Menispermaceae) is traditionally used as a rejuvenator.13 It has also been shown to improve cognitive decline14 and reportedly manage oxidative stress-related diseases through multiple modes of action.15 Our earlier findings have shown that the hydro-alcoholic T. cordifolia stem extract (TCE) is a potent inhibitor of CYP2D6.16 It was also shown to inhibit the enzymatic activity of CYP3A4.16 However, the mechanism of these metabolic enzyme inhibitions is not clear. Thus, analysis of phytocomponents of TCE and their potential to inhibit these enzymes through in silico methods can suggest the possibility of TCE to improve the bioavailability of DEM. Besides, TCE has been well-reported for its benefits against AD.17 Although the mechanisms of action of TCE against AD are unclear, it has been shown to reduce glutamate-induced excitotoxicity,18 a significant contributor to dementia. Moreover, its antioxidant and anti-inflammatory properties are associated with its ability to protect against neurodegeneration.19 Taken together, TCE can potentially complement DEM against neurodegeneration and AD. Thus, it is desirable to investigate TCE’s effect on DEM’s pharmacokinetics. Earlier, our group developed an LC-MS/MS method for determining DEM and DEX from preclinical samples using a very low volume of plasma.20 However, this method cannot be directly applied to estimate the pharmacokinetics of DEM and DEX coadministered with QN. This is because the presence of QN may interfere with the assay. Hence, it is necessary to revalidate the LC-MS/MS method to study the pharmacokinetics of DEM and DEX when administered with QN. Keeping these in view, the current investigation (Figure S2) was performed to assess TCE’s ability to improve DEM’s bioavailability and efficacy for management of AD. This was supported by preclinical and in silico studies to demonstrate the potential for its complementary application.
2. Materials and Methods
2.1. Chemicals and Reagents
TCE was procured from Kisalaya Herbals, Ltd. (Indore, MP, India), and authenticated by the LC-MS profile of the critical component (Figure S3). Working standards and Internal Standards DEM, DEX, DEM-d3, and DEX-d3 purity (>99%) were purchased from BioOrganics (Bangalore, India). QN sulfate (>99% pure) was purchased from VIVAN Life Sciences Pvt. Ltd, Mumbai. Reference standrad (RS) of DEM was procured from Divi’s Laboratories Limited. Formic acid and HPLC-grade methanol of Sigma-Aldrich (Missouri, USA) were used. The LABJAL water system (Labindia, India) was used to prepare in-house ultrapure water. Rat plasma treated with anticoagulant (heparin) of Prado Pvt., Ltd. (Pune, India), was used.
2.2. In Silico Analysis of Phytocomponents and Their Potential for Inhibition of CYP2D6 and CYP3A4
A total of 75 nonduplicate phytoconstituents of TCE were collected from published articles and chemical databases, including PubChem and DrugBank.21−23 The Canonical Simplified Molecular Input Line-Entry System (SMILES) of each active ingredient was retrieved, and gastrointestinal (GI) absorption, intestinal absorption, oral bioavailability, and CYP enzyme (CYP2D6 and CYP3A4) inhibition activity were predicted using the SwissADME,24 ADMETlab25 admetSAR,26 and vNN-ADMET27 web servers.
The crystal structure of CYP2D6 (PDB code: 3TBG) cocrystallized with thioridazine (RTZ) and CYP3A4 (PDB code: 3NXU) cocrystallized with ritonavir (RIT) was obtained from the Protein Data Bank (PDB, https://www.rcsb.org). Both crystal structures were prepared using the Schrodinger suite’s protein preparation wizard. Similarly, the collected active ingredients of TCE were prepared using the LigPrep module of the Schrodinger suite to generate the correct energy-minimized 3D molecular stereoisomer of each phytocompound. For docking phytocompounds into the active site of the CYP enzymes, a receptor grid of 12 Å around the centroid of the crystallized ligand was generated. Moreover, the stereoisomers of phytocompounds were flexibly docked using the Glide module of the Schrodinger suite in extra-precision (XP) mode. Furthermore, the docked phytocompounds were reranked by estimating their relative binding-free energy (ΔGbind) using molecular mechanics generalized Born surface area (MM/GBSA) post docking scoring protocol where ΔGbind = ΔGsolv + ΔEMM + ΔGSA. While the ΔGsolv term is related to the difference in solvation energy of the complex and unbound form, ΔEMM and ΔGSA present differences in minimized energies and surface area energies, respectively. The cocrystallized ligands were used as controls in the study.
2.3. Authentication of TCE
The berberine standard (98.93% purity) was procured from VIVAN Life Sciences Pvt., Ltd., Mumbai. The mass parameters for the berberine standard were optimized (polarity: positive; multiple reaction monitoring (MRM, parent ion/product ion): 336.1/320.0); compound parameters: declustering potential (DP, 80 V), entrance potential (EP, 10 V), collision energy (CE, 30 V), collision cell exit potential (CXP, 9 V), ion spray voltage (IS, 5500V); source parameters: ion source gas (GS, 1; 45 psi), GS2(50 psi), collision associated dissociation (CAD, 6 psi), curtain gas (CUR, 30 psi), and temperature(450 °C)). The berberine (100 ng/mL) and TCE (2000 ng/mL) solutions were prepared using a diluent (methanol:water 80:20). The samples were analyzed using Agilent Poroshell 120 EC-C18 100 × 4.6 mm, 4 μ column, methanol: 0.1% formic acid in water as mobile phase, methanol:water (50:50) as rinsing solution, column oven (40 °C), autosampler (5 °C), injection volume 10 μL, and flow rate of 0.6 mL/min. The mobile phase was varied with different proportions of (50:50, 60:40, 70:30, and 80:20) an aqua organic mixture. Furthermore, a tuning solution of TCE was prepared by dissolving it in methanol. The solvent was Q1 scanned from 200 to 1000 m/z using an API 4000 QTRAP mass spectrometer. The TCE was scanned in the same range in the positive polarity mode. The phytoconstituents of TCE including N-formylannonaine, N-feruloyltyramine, berberine, jatrorrhizine, corydine, luteanine, tembetarine, palmatine, and rotundine were monitored (Figure S3). The m/z (M+1) of these compounds was confirmed in the Q1 scan. For further confirmation, the mass fragmentation (Q1/Q3) pattern of well-known compounds like berberine, jatrorrhizine, and palmatine was analyzed (Figure S4).
2.4. Instrumentation and Analysis Conditions (UPLC-MS/MS)
The LC-MS/MS system comprised an Agilent 1290 Infinity II UPLC system and an AB SCIEX API 4500 Triple Quad Tandem Mass Spectrometer (Singapore) with an ESI source (electrospray ionization source). Chromatographic separation was achieved using a UPLC Eclipse Plus C18 column (5 μm, 100 × 4.6 mm: Agilent, California, USA). The separation was optimized with an isocraticsystem in which methanol and formic acid in water (0.1%) (60:40, v/v) were used as the mobile phase.
AB SCIEX API 4500 Triple Quad mass spectrometer was equipped with an ESI source for detection and mass analysis. All analytes were quantified using positive MRM mode, and the compound-dependent parameters are listed in Table S1. The dependent parameters like nebulizer gas, curtain gas 40 (GS1 40), drying gas (GS2) 60, collision gas (CAD) 12, source temperature 550 °C, and ion spray voltage (IS) 5000 were optimized parameters for better sensitivity. An updated version of Analyst software, i.e., 1.7.2, was used to evaluate all the data.
2.5. Preparation of Calibration Curve (CC) and Quality Control (QC) Samples
Different stocks were utilized to prepare the CC and QC samples. The stock solutions DEX, DEM, DEX-d3, and DEM-d3 of 1.0 mg/mL concentrations were prepared using methanol as solvent. The working standard solutions of CC (calibration standards) and QC samples were prepared by the serial dilutions technique using methanol:water (50:50, v/v) as diluent. The concentrations of these samples were prepared 20 times higher than the spiked calibration standards and QC samples. The working solution of CC was spiked into interference-free blank plasma in the proportion of 50 μL working solution and 950 μL blank plasma. The CC for DEM was established at 0.20, 0.39, 0.78, 2.61, 8.71, 29.04, 72.60, 161.34, 322.69, and 403.36 ng/mL and the same for DEX at 0.10, 0.20, 0.41, 1.35, 4.52, 15.05, 37.62, 83.61, 167.21, and 209.02 ng/mL in the spiked plasma. The working solution of QN was spiked into blank plasma to prepare in the presence of blank plasma containing QN (concentration about 2000 ng/mL). This presence of blank plasma containing QN was used to prepare different QC samples. The concentrations 0.20, 0.58, 142.18, and 302.52 ng/mL and 0.10, 0.30, 73.68, and 156.76 ng/mL were considered as LLOQ, LQC, MQC, and HQC samples for DEM and DEX, respectively.
2.6. Sample Preparation
The frozen CC standards, blank rat plasma, QC samples, and preclinical study samples were retrieved from a deep freezer set at −70 °C and allowed to thaw at room temperature. An aliquot of rat plasma samples (30 μL) and a mixture of IS solution (50 μL) (i.e., 50 and 40 ng/mL for DEM-d3 and DEX-d3, respectively) were taken in a polypropylene tube and vortexed for about 30 s. This was followed by the addition of 100 μL of a formic acid solution (0.1% prepared in water). Then, these samples were again vortexed for approximately 30 s to ensure proper mixing. The samples were extracted by the solid phase extraction (SPE) technique using a Hi-Purit DURA HLB SPE cartridge, 1 cm3, 30 mg of a National Chromatography cartridge. The SPE cartridge was preconditioned with methanol (1 mL) followed by water (1 mL). This preconditioned cartridge was loaded with the entire sample with gentle pressure. Then, the cartridges were washed with methanol (1 mL, 5%) and water (1 mL) to remove the unwanted matrix components. Then, cartridges were kept at high pressure for around 2 min for drying. After complete drying, the samples were eluted with 300 μL of mobile phase (methanol:0.1% formic acid in water in the volume ratio of 60:40). Then, the samples were transferred into pre-labeled autosampler vials and 10 μL samples from these vials were injected into the UPLC-MS/MS system for analysis.
2.7. Method Validation
The developed analytical method was validated for sensitivity, selectivity, specificity, matrix effect, linearity, precision and accuracy, recovery, and stabilities in accordance with the US FDA (2018), EMA (2012), and ICH M10 (May 24, 2022) guidelines.
2.7.1. Selectivity
Six samples of plasma collected from six healthy rats were treated as a blank. One representative LLOQ for each lot was processed along with the blank sample. Along with this, standards of CC and batch qualifying samples [LQC, MQC, and HQC] were processed as mentioned in Section 2.6 and then analyzed. Each blank plasma lot was estimated at retention time (RT) and mass–over charge ratio (m/z) of DEM, DEX, DEM-d3, and DEX-d3 interference.
2.7.2. Specificity
The specificity study assessed any process conversion of analytes, and internal standards (IS) during quantification. DEM, DEX, and QN (2000 ng/mL) at the ULOQ concentration were spiked separately to plasma. Individual IS (i.e., DEM-d3 and DEX-d3 were spiked separately in rat plasma at a working concentration. At the lowest quantification limit, a blank sample was spiked with a mixture of analytes, i.e., DEM and DEX. The above specificity samples were processed as per sample preparation procedure Section 2.6. Then, these samples were assessed for any interference observed at RT and m/z for the respective molecules to conclude any process conversion.
2.7.3. Matrix Effect
Six different rat
plasma lots at LQC and HQC concentration levels were evaluated to
determine the matrix effect. The comparison of the area response of
the analyte with matrix and without matrix was used to assess the
matrix factor (MF). The formula used to calculate the MF for analyte
and IS is  , and that for the IS-normalized factor
is
, and that for the IS-normalized factor
is  . The assessment was performed with aqueous
and extracted samples containing equal amounts of both analyte and
IS. Then, the MF (IS normalized) was calculated for DEM and DEX to
assess the IS-normalized matrix effect.
. The assessment was performed with aqueous
and extracted samples containing equal amounts of both analyte and
IS. Then, the MF (IS normalized) was calculated for DEM and DEX to
assess the IS-normalized matrix effect.
2.7.4. Linearity
For DEM, the concentration range was established from 0.20 to 403.36 ng/mL, while for DEX, it was 0.10 to 209.02 ng/mL. The CCs for DEM and DEX were generated by considering the peak area ratio relative to their corresponding IS against respective nominal concentrations in plasma. The linearity within the specified concentration ranges was established through a least-squares regression analysis with a weighing factor of 1/x2.
2.7.5. Precision and Accuracy
The precision and accuracy of the method were established in six replicates of the LLOQ QC, LQC, MQC, and HQC concentration levels. Intraday and interday precision and accuracy were performed on different analytical days, explaining the validation runs’ consistency and reproducibility. The % relative standard deviation (RSD), besides the mean of % accuracy, was considered to assess precision and accuracy. As per the acceptance criteria of method validation, the mean % accuracy should be between 85 and 115% except for LLOQ QC for which this restriction is eased, i.e., 80 to 120%. The % RSD should be within 15%, except for LLOQ QC, which is 20%.
2.7.6. Sensitivity
The sensitivity of an analytical method at the lower limit of quantification (LLOQ), the signal-to-noise (S/N) ratio, accuracy, and precision are evaluated using LLOQ samples from three different batches. Six replicates per LLOQ sample are analyzed. The S/N ratio is calculated by dividing the average signal response by the average noise level. The S/N ratio for each analyte should be greater than 5. Accuracy was determined by comparing the mean concentration with the nominal concentration, while precision was assessed using the coefficient of variation (CV). Acceptable accuracy is usually within ±20%, and the precision should be ≤20%.
2.7.7. Recovery
The SPE procedure’s relative recovery was assessed by comparing the peak area of the response of extracted QC samples with QC samples prepared using a postextracted blank matrix. This evaluation aimed to determine the efficiency of the extraction process. The comparison was conducted at low, middle, and high QC concentration levels to assess the extraction efficiency across various concentrations. By analyzing the peak area responses, the closeness of the extracted QC sample responses to those of the QC samples prepared with the postextracted blank matrix indicated the recovery efficiency.
2.7.8. Stability
The stability of analyte DEM and DEX in rat plasma was estimated by utilizing the two QC levels, i.e., LQC and HQC (n = 6 for each QC level), under the following conditions: freeze thaw stability for five cycles, wet extract stability at refrigerator, benchtop stability at room temperature, autosampler stability at 5 °C, and long-term storage stability for 49 days at −70 °C.
2.8. Pharmacokinetics Study
This study was designed to investigate the comparative effect of the QN and TCE extract on the pharmacokinetics of DEM in pathogen-free Wistar rats. A total of 36 animals (male and female) having weights between 200 and 250 g were purchased from Prado Pvt., Ltd. (Pune, India). Before initiation of experiments, rats were allowed 7 days of acclimatization in the animal cages under ambient temperature (25 ± 1 °C) and fed with standard rodent chow and tap water ad libitum. The rats were kept in fasting condition for about 12 h before the start of the experiment; however, they were free to drink water. All studies were approved by the institutional animal ethical committee of the School of Pharmaceutical Sciences, Siksha O Anusandhan University (Deemed to be University), Bhubaneswar, Odisha, India (07/21/IAEE/SPS/SOAU), and conducted in line with the guidelines of the committee on the care and use of laboratory animals.
To investigate the effect of TCE on the oral pharmacokinetics of DEM, two types of studies were planned based on the single pretreatment groups (group A) and multiple pretreatment groups (group B). Each group contained 18 rats. Furthermore, each group was divided into three different subgroups (A-1, A-2, A-3, B-1, B-2, and B-3), having six rats in each subgroup. After 12 h of fasting, A-1, A-2, and A-3 group animals were administered with QN (2.5 mg/kg), TCE (100 mg/kg), and TCE (400 mg/kg), respectively, as single pretreatment. After 2 h of pretreatment, a single DEM dose (5 mg/kg) was administered and blood samples were collected as per the predetermined time points.
Animals of groups B-1, B-2, and B-3 were administered daily with QN (2.5 mg/kg), TCE (100 mg/kg), and TCE (400 mg/kg), respectively, for 14 days as multiple pretreatments. After 2 h of the 14th day’s pretreatment dose, a single dose of DEM (5 mg/kg) was administered. The blood samples (0.2 mL) were directly collected from the jugular vein at 0 (predose), 0.08, 0.25, 0.5, 0.75, 1.0, 1.5, 2.0, 4.0, 6.0, 8.0, 10.0, and 24.0 h time intervals after administration, and the samples thus collected were transferred into the prelabeled tubes containing heparin as an anticoagulant. These collected samples were centrifuged at 5000 rpm for 10 min without delay. After centrifugation, 100 μL of plasma was aliquoted and shifted to a separate tube. The tubes were then stored at a temperature of −70 °C to maintain their integrity and prevent degradation until further analysis. Pharmacokinetic parameters like maximum drug plasma concentration (Cmax), area under the curve (AUC), mean residence time (MRT), drug clearance (CL), biological half-life (t1/2), and maximum peak time (Tmax) were calculated.
2.9. Network Pharmacology of TCE for Effect against AD
Phytoconstituents of TCE that were predicted to have good blood–brain barrier (BBB) permeability and comply with Lipinski’s rule of five were selected for this analysis. The targets of these ingredients were predicted by entering their canonical SMILES values into the SwissTargetPrediction and SuperPred web servers. The predicted common targets of “Homo sapiens” only were selected for gene–disease association (GDA) analysis. The association of common targets with AD was done using the R package disgenet2r. Those targets having a GDA score ≥0.3 and associated with AD were retained for functional enrichment analysis and network construction.
For functional pathway and gene ontology enrichment analyses, the Kyoto Encyclopedia of Genes and Genomes (KEGG) pathway and gene ontology (GO) enrichment analyses of AD disease-associated targets were carried out by submitting the list of genes to the ShinyGO web server. The top 10 KEGG pathways and GO terms based on enrichment FDR (p-value ≤0.05) and fold enrichment were plotted using the SRplot data visualization web server. The KEGG and GO enrichment analyses revealed the possible functional pathways and GO terms of the AD disease-associated targets.
Furthermore, the protein–protein interaction (PPI) between AD disease-associated targets was retrieved by searching gene names in the STRING database with species as ″Homo sapiens″ and a confidence score >0.4. Parallelly, the compound-target-pathway network was constructed and visualized using Cytoscape software and analyzed using NetworkAnalyzer plugins of Cytoscape.
2.10. Effect on Scopolamine-Induced Dementia
For study of the effect on scopolamine-induced dementia, Wistar rats of either sex weighing between 180 and 200 g were procured from M/S Saha Enterprise, Kolkata, and housed in the animal facility of School of Pharmaceutical Sciences, Siksha ‘O’ Anusandhan (Deemed to be University), Bhubaneswar, Odisha, India. The studies were conducted in accordance with the protocol approved by the institutional animal ethical committee (07/21/IAEE/SPS/SOAU). The rats were kept in cages and maintained under standard husbandry conditions (12:12 h light/dark cycle, controlled room temperature (23 ± 2 °C), stress-free, ad libitum water, standard diets, and sanitary conditions). Before the experiment was begun, the rats were allowed to acclimatize for a period of 1 week to reduce stress. The study was accepted and approved by the institutional ethical committee (07/21/IAEE/SPS/SOAU) of the School of Pharmaceutical Sciences, Siksha ‘O’ Anusandhan (Deemed to be University), Bhubaneswar, Odisha, India.
Scopolamine is known to cause dementia through multiple mechanisms including impairment of cholinergic transmission and oxidative stress.28 Accordingly, this method has been widely used as a model for AD in rats.29 Following these reported protocols, the effect of TCE and DEM against dementia was evaluated. Briefly, animals were trained for 14 days in a rectangular maze. After acclimatization and training, the animals were grouped into four groups consisting of six animals each. Amnesia was induced in all of the groups by daily intraperitoneal injections of scopolamine (1 mg/kg) for 9 consecutive days. The animals were grouped as follows: (i) group 1: control (2 mL of saline po); (ii) group 2: standard (QN (2.5 mg/kg) and DEM (5 mg/kg) after 2 h of QN); (iii) group 3: TCE (400 mg/kg); (iv) group 4: TCE (400 mg/kg) and DEM (5 mg/kg) after 2 h of TCE. Each day, the test compounds were administered before 1 h of scopolamine induction and the behavioral tests were performed after 1 h after that. After the ninth day, the animals were sacrificed by higher dose of ketamine and xylazine. The brains of the animals were isolated and kept in a 10% formalin solution for histopathological analysis.
The nootropic potential was evaluated by a rectangular (Hebb William) maze, which is a fully enclosed rectangular box that includes an entrance (A) and a reward chamber (B) situated at opposite ends. The box is divided by wooden slats into blind passages, leaving only a twisting corridor (C) connecting the entrance (A) to the reward chamber (B). After familiarization, the rat was placed in the entrance chamber and a timer was activated. The time it took for the rat to reach the reward chamber was recorded as the trial’s learning score. The learning score for each day was obtained. The locomotor and exploratory behaviors of the rats were measured by the open field test. The test animals were kept at the center of the test platform with a 1 m2 area with a height of 0.4 m to prevent escape of animals. The experiment was conducted in a quiet room satisfactorily lit. This study was conducted after 2 h of rectangular maze test on the first, fifth, and ninth days. Animals were monitored for a period of 3 min, and the numbers of square crossings were noted.
After the completion of the ninth day study, rats were sacrificed (after being anesthetized) and decapitated. The skull was opened and the brain was cut along the sagittal plain and fixed in formalin (10% solution in saline) and sent for histological slide preparation to the pathologist. The slides were examined by a fluorescence microscope with 100× magnifications.
2.11. Statistical Analysis
All of the collected data are evaluated in terms of mean ± standard deviation (SD). The one-way ANOVA was used to analyze the collected data. The Statistical Analysis Software (SAS) used noncompartmental analysis to examine the pharmacokinetic parameters.
3. Results and discussion
3.1. In Silico Analysis of Phytocomponents and Their Potential for Inhibition of CYP2D6 and CYP3A4
TCE has been widely investigated, and 75 unique phytocomponents were found from different databases.21−23 For any significant effect on CYP enzymes in the liver, the components are expected to have good intestinal permeability. Thus, these 75 compounds were filtered based on the likelihood of their intestinal permeability using the consensus results of different web servers, including SwissADME,24 ADMETlab,25 admetSAR,26 and vNN-ADMET.27 These web servers also predict the potential of ligands to inhibit CYP enzymes. These are primarily based on the pharmacophore models and classify inhibitors based on the structural features30 within the limitations of the data set used to develop the pharmacophore. Because of this limitation, a complete consensus was not observed for inhibiting CYP2D6 and CYP3A4 among the phytocompounds. Therefore, molecular docking followed by MM/GBSA analysis using the Schrodinger suite Glide docking module in extra-precision mode (XP) was undertaken. Although widely used, the docking scores often fail to differentiate between <1.5 kcal/mol binding affinity differences. Thus, additionally, the ΔGBind score was used. This free energy score is based on MM/GBSA that combines molecular mechanics energies with generalized Born and surface area continuum solvation and can minimize the false positives.31 It is preferable to use the consensus of the docking score and ΔGbind to rank the phytocompounds as inhibitors of CYP enzymes. Based on the above predicted properties, phytocompounds with high intestinal permeability, CYP enzyme inhibition activity (probability >80%; at least by two tools), XP docking score ≤−6.0 kcal/mol, and ΔGbind ≤−60.0 kcal/mol were considered as potential CYP enzyme inhibitors.
Using these criteria (Table 1), molecules M30 (CID: 4840), M35 (CID: 550072), berberine (CID: 2353), jatrorrhizine (CID: 72323), luteanine (CID: 48704), and rotundine (CID: 5417) were predicted to inhibit CYP2D6. Similarly, in the case of CYP3A4, n-formylannonaine (CID: 23251787), jatrorrhizine, luteanine (CID: 48704), corydine (CID: 111119), magnoflorine iodide (CID: 3999), and M42 (CID: 4622630) were predicted as possible inhibitors (Table 1). Moreover, jatrorrhizine and luteanine were found to be potential inhibitors of both CYP enzymes. More than the docking scores, the binding mode helps distinguish a binder from a nonbinder. Thus, the binding modes of the above selected compounds were studied by visualizing their protein–ligand interaction profiles using the PLIP.32 The cocrystallized ligands were used as controls in this study. RTZ has been experimentally shown to have a hydrophobic interaction with LEU110, ALA209, LEU213, PHE247, ILE297, and ALA300 of CYP2D6 with no hydrogen bonding.33 These residues were also predicted in the interaction between RTZ and CYP2D6 without hydrogen bonding (Table 1). RIT has been experimentally demonstrated to interact with CYP3A4 through hydrogen bonding (SER119), hydrophobic interaction (PHE57, PHE108, LEU210, PHE215), and π–π stacking (PHE213).34 The predicted binding mode also showed interactions with these residues (Table 1). Thus, the predicted binding modes of control are close to the experimentally determined mode of interaction and suggest the utility of using the binding mode analysis to support the potential for inhibiting these enzymes. The phytocompounds screened for CYP2D6 inhibition ability were found to bind to the same cavity in close proximity to the site at which RTZ is known to bind (Figure 1). Similarly, the phytocompounds were found to attach to the site where RTZ is known to interact with CYP3A4 (Figure 1). Although variations were observed in interactions with specific residues, some residues that are shown in the interaction of cocrystallized ligands were also found to be involved in the interaction with these phytocompounds. Taken together, the docking score, ΔGbind, and binding mode analysis suggest the potential of these phytocompounds to inhibit these CYP enzymes. However, further experimental studies are necessary to validate the ability of these phytocompounds to inhibit CYP enzymes. Nonetheless, some of these have been shown to inhibit these enzymes in vitro. While jatrorrhizine is reported to inhibit CYP3A4,35 berberine36,37 and corydine38 have been shown to inhibit CYP2D6 and CYP3A4. Because phytocompounds of extracts often have holistic properties, the contribution from other components cannot be ruled out. These data partly explain the potential of TCE to inhibit the metabolic activity of CYP2D6 and CYP3A4.16
Table 1. Interacting Residues Involved in Interactions of CYP’s Enzymes and Potential Inhibitorsa.
| enzyme | inhibitor | H-bonds | hydrophobic | π-cation | π–π stacking | salt bridges | XP GScore(kcal/mol) | ΔGbind(kcal/mol) |
|---|---|---|---|---|---|---|---|---|
| CYP2D6 | RTZ | LEU110, PHE120, ALA209, LEU213, GLN244, PHE247, ILE297, ALA300, VAL308, PHE483, LEU484 | GLU216, ASP301 | –7.07 | –72.57 | |||
| M30 | LEU213, GLU216, THR309, VAL370, VAL374 | –6.20 | –73.78 | |||||
| M35 | SER304 | PHE120, ASP301, ALA305, THR309, VAL370, VAL374 | –6.02 | –65.40 | ||||
| M37 | PHE120, LEU213, VAL374, PHE483 | –7.27 | –85.15 | |||||
| M38 | PHE120, LEU213, VAL374, PHE483 | –7.48 | –83.12 | |||||
| M39 | GLN244 | PHE120, GLN244, ALA300 | ASP301 | –7.12 | –67.86 | |||
| M44 | SER304 | PHE120, LEU213, GLU216, VAL374, PHE483 | –6.69 | –64.36 | ||||
| CYP3A4 | RIT | SER119, ARG372, LEU483 | PHE57, ARG106, PHE108, ILE120, LEU210, PHE213, PHE215, THR224, PHE241, ILE301, PHE304, ILE369, LEU373 | PHE213 | –10.03 | –62.42 | ||
| M33 | SER119, THR309 | ILE120, PHE241, ILE301 | –6.94 | –60.45 | ||||
| M38 | THR309 | PHE108 | ARG105 | –6.49 | –70.96 | |||
| M39 | ILE301, PHE304 | –6.93 | –65.95 | |||||
| M40 | ILE369, MET371, ARG372, LEU483 | ILE369, LEU482 | –8.81 | –66.66 | ||||
| M41 | ILE369, MET371, ARG372, GLY481, LEU483 | PHE304, ILE369, LEU482 | –8.34 | –73.48 | ||||
| M42 | THR309, ILE369, LEU483 | ILE369, LEU482 | –10.15 | –65.89 |
Thioridazine (RTZ) and ritonavir (RIT) were taken as control inhibitors. The interactions analysis was performed using online web tool protein-ligand interaction profiler (PLIP). M30: piperidine, 1-(5-(1,3-benzodioxol-5-yl)-1-oxo-2,4-pentadienyl)-; M33: N-formylannonaine; M35: dasycarpidan-1-methanol, acetate (ester); M37: berberine; M38: jatrorrhizine; M39: luteanine; M40: (±)-corydine; M41: (+)-magnoflorine iodide; M42:7-hydroxy-1-[(3-hydroxy-4-methoxyphenyl)methyl]-6-methoxy-2,2-dimethyl-1,2,3,4-tetrahydroisoquinolin-2-ium; M44: rotundine.
Figure 1.

Binding mode of selected compounds in comparison with reported inhibitors, i.e., ritonavir (RIT) and thioridazine (RTZ). (A, C) Binding mode of redocked thioridazine (green) and ritonavir (magenta) in CYP2D6 and CYP3A4, respectively. (B) Binding mode of M30 (CID: 4840; dark blue), M35 (CID: 550072; light blue), berberine (CID: 2353; cyan), jatrorrhizine (CID: 72323; green), luteanine (CID: 48704; yellow), and rotundine (CID: 5417; bricks red) in CYP2D6 enzyme. (D) Binding mode of n-formylannonaine (CID: 23251787, dark blue), jatrorrhizine (light blue), luteanine (CID: 48704; cyan), corydine (CID: 111119; green), magnoflorine iodide (CID: 3999; yellow), and M42 (CID: 4622630; bricks red) in CYP3A4 enzyme. The iron-protoporphyrin IX molecule is shown in orange color.
3.2. Authentication of TCE
Berberine is an important phytocomponent of TCE. Its reference standard was used as a marker to compare RT with different mobile phases. The RT of TCE exactly matched that of berberine in all chromatography conditions (Figure 2). The fragmentation pattern was also similar (Figure S3), confirming the presence of berberine in the TCE. Along with the certificate of analysis, this LC-MS study indicated the authenticity of TCE.
Figure 2.

Chromatograms of berberine and TC extract at different chromatographic conditions like mobile phase 80:20 (chromatograms A and B), mobile phase 50:50 (chromatograms C and D), mobile phase 60:40 (chromatograms E and F), and mobile phase 70:30 (chromatograms G and H).
In silico analysis has revealed that along with berberine, multiple TCE components can potentially inhibit CYP2D6 and CYP3A4 (Table S2). Therefore, LC-MS analysis was carried out to assess the presence of phytocomponents with potential affinity for CYP2D6 and CYP3A4. In the absence of a standard marker, the Q1/product ion scan can be used as an alternative tool to assess the presence of phytocomponents. The Q1 scan of TCE solution showed m/z (M + 1) values that matched with the parent ion mass of several phytoconstituents of TCE, including N-formylannonaine, N-feruloyltyramine, berberine, jatrorrhizine, corydine, luteanine, tembetarine, palmatine, and rotundine (Figure S3). Furthermore, the product ion spectra of TCE showed fragmentation that can be attributed to representative compounds, including berberine, jatrorrhizine, and palmatine, based on their reported MS/MS data (Figure S4).38 Thus, the LC-MS profile of the extract showed parent ion peaks (M + 1) for most of the phytocompounds that have been shown to have an affinity for CYP2D6 and CYP3A4, and TCE is likely to inhibit these CYP enzymes that may decrease the metabolism of DEM.
3.3. UPLC-MS/MS Method Validation
3.3.1. Selectivity
The selectivity of the method for DEM, DEM-d3, DEX, and DEX-d3 was assessed by comparing the area response of the LLOQ to that of a clean rat plasma sample (blank). Interference present was found to be less than 0.45% for the analytes and less than 0.62% for the ISs in the blank rat plasma samples when compared with the corresponding responses in the LLOQ sample. The absence of significant interference confirms the method’s selectivity in accurately quantifying DEM and DEX in rat plasma, indicating that the measured signals primarily originate from the target analytes of interest.
3.3.2. Specificity
The interference was assessed at RT and m/z of DEM for samples DEX, DEM-d3, DEX-d3, and QN, and all predose samples (PD) of 36 rats that were used during the study. Furthermore, the interference was assessed at RT and m/z of DEX for samples DEM, DEM-d3, DEX-d3, QN, and all predose (PD) samples of 36 rats that were used during the study. No significant interference was observed at RT and m/z of analyte and IS, indicating the specificity of the method for simultaneous estimation of DEM and DEX. The chromatograms of DEM, DEX, DEM-d3, DEX-d3, QN, and PD are shown in Figure 3 and Table 2.
Figure 3.

Chromatogram of the analytes in rat plasma. (A) (1) Blank sample for DEM, (2) LLOQ for DEM, (3) ULOQ for DEM, (4) rat plasma sample at 0.25 h. (B) (1) Blank sample for DEX, (2) LLOQ for DEX, (3) ULOQ for DEX, (4) rat plasma sample at 0.25 h.
Table 2. Specificity for DEM and DEX and Their IS (n = 3).
| analyte/internal standard | % of interference for DEM | % of interference for DEM-d3 | % of interference for DEX | % of interference for DEX-d3 |
|---|---|---|---|---|
| DEM (400 ng/mL) | 0.00 | 0.17 | 0.00 | |
| DEM-d3 (50 ng/mL) | 0.08 | 0.00 | 0.00 | |
| DEX (200 ng/mL) | 0.02 | 0.00 | 0.00 | |
| DEX-d3 (40 ng/mL) | 0.00 | 0.00 | 0.03 | |
| QN (2000 ng/mL) | 0.00 | 0.00 | 0.00 | 0.00 |
3.3.3. Matrix Effect
No significant enhancement/suppression of the detector response was observed in all lots of rat plasma at LQC and HQC levels. The MF (IS normalized) for DEM and DEX were also within the range of 0.85 to 1.15 (Table 3). The %CV of the MF (IS normalized) for both was below 5%. This indicates a lack of significant matrix effect, suggesting the suitability for quantifying DEM and DEX from rat plasma.
Table 3. Recovery and Matrix Factor for DEM and DEX and Their IS (n = 6).
|
recovery |
matrix factor |
|||||||||
|---|---|---|---|---|---|---|---|---|---|---|
| QC level | ||||||||||
| LQC | MQC | HQC | LQC | HQC | ||||||
| compound | mean recovery (%) | CV (%) | mean recovery (%) | CV (%) | mean recovery (%) | CV (%) | IS normalized factor | CV (%) | IS normalized factor | CV (%) |
| DEM | 99.95 | 9.83 | 97.81 | 4.16 | 97.43 | 5.47 | 1.04 | 4.56 | 1.00 | 2.88 |
| DEM-d3 | 97.99 | 10.38 | 99.25 | 6.29 | 102.24 | 6.58 | ||||
| DEX | 95.57 | 5.48 | 103.51 | 6.03 | 100.42 | 3.39 | 0.99 | 3.34 | 1.03 | 3.96 |
| DEX-d3 | 97.42 | 4.02 | 96.79 | 2.14 | 101.51 | 3.84 | ||||
3.3.4. Linearity
The developed method was found linear (r2 > 0.99) from 0.20 ng/mL to 403.36 ng/mL and from 0.10 ng/mL to 209.02 ng/mL for DEM and DEX, respectively. This dynamic range was adequate for quantifying DEM and DEX in the preclinical study (Table 4).
Table 4. Linearity and Sensitivity for DEM and DEX in Rat Plasma.
| analytes | linear range (ng/mL) | LLOQ (ng/mL) | S/N for LLOQ | slope | intercept | r |
|---|---|---|---|---|---|---|
| DEM | 0.196 to 403.356 | 0.196 | 22 | 0.0179 | 0.122 | 0.9970 |
| DEX | 0.102 to 209.017 | 0.102 | 48 | 0.011 | 0.0799 | 0.9998 |
3.3.5. Precision and Accuracy
To evaluate the precision and accuracy, four QC levels in six replicates (LLOQ QC, LQC, MQC, and HQC) were analyzed through 10 CC standards (Table 5) using three analytical runs through 2 days. The precision (%CV) of back-calculated concentrations of DEM and DEX for the interday analysis were found from 2.21 to 4.76 and from 2.53 to 9.09, respectively. The method was found precise for the intraday analysis, too, with %CV in the range of 3.56 to 9.52 (DEM) and 3.64 to 10.00 (DEX). The mean interassay accuracy of the method for analysis of DEM and DEX was found in the ranges of 98.28–105.00 and 96.67–110.00%, respectively. Similarly, the accuracy for intra-assay was found acceptable in the range of 98.99 to 105.00% for DEM and from 98.19% to 100.00% for DEX. Thus, the newly developed method was accurate and precise per ICH guidelines (M10) to quantify DEM and DEX.
Table 5. Accuracy and Precision for DEM and DEX in Rat Plasma (n = 6).
|
interday |
intraday |
||||||
|---|---|---|---|---|---|---|---|
| analyte name | nominal conc. (ng/mL) | mean ± SD | accuracy (%) | precision (% CV) | mean ± SD | accuracy (%) | precision (%CV) |
| DEM | 0.20 | 0.21 ± 0.01 | 105.00 | 4.76 | 0.21 ± 0.02 | 105.00 | 9.52 |
| 0.58 | 0.57 ± 0.03 | 98.28 | 5.26 | 0.60 ± 0.05 | 103.45 | 8.33 | |
| 142.18 | 143.29 ± 3.16 | 100.78 | 2.21 | 142.81 ± 5.79 | 100.44 | 4.05 | |
| 302.52 | 301.97 ± 8.42 | 99.82 | 2.79 | 303.04 ± 12.37 | 98.99 | 3.56 | |
| DEX | 0.10 | 0.11 ± 0.01 | 110.00 | 9.09 | 0.10 ± 0.01 | 100.00 | 10.00 |
| 0.30 | 0.29 ± 0.02 | 96.67 | 6.90 | 0.30 ± 0.02 | 100.00 | 6.67 | |
| 73.68 | 73.93 ± 3.26 | 100.34 | 4.41 | 74.06 ± 3.19 | 100.52 | 4.31 | |
| 156.76 | 155.35 ± 3.93 | 99.10 | 2.53 | 153.92 ± 5.61 | 98.19 | 3.64 | |
3.3.6. Sensitivity
The method was sensitive enough to measure DEM at 0.20 ng/mL and DEX at 0.10 ng/mL as the LLOQ. Mean accuracies from three runs of six successive LLOQ samples were 105.00% for DEM and 100.00% for DEX. All LLOQ samples were found to have accuracy within a range of 80 to 120%. Precision (%CV) was ±5.76 for DEM and ±10.50 for DEX. The method shows sufficient sensitivity, acceptable accuracy, and precision, making it suitable for quantifying DEM and DEX at low concentrations (Table 4).
3.3.7. Recovery
The SPE’s extraction efficiency was assessed regarding analyte and IS recovery from the rat plasma (Table 5). The recoveries of DEM were found to be 99.95, 97.81, and 97.43% at low, middle, and high QC levels, respectively. The consistent recoveries of DEX were observed to be 95.57, 103.51, and 100.42% for low QC, middle QC, and high QC levels, respectively. Recoveries of ISs were 99.83 and 98.57% for DEM-d3 and DEX-d3, respectively. The precise and high-efficiency recovery at three gradient levels for DEM and DEX advocates that the method is valid for quantifying DEM and DEX from rat plasma.
3.3.8. Stability
Different stability experiments like benchtop stability, autosampler sample stability, wet extract stability, processed sample stability, freeze–thaw stability, and long-term stability were executed for DEM and DEX in the plasma of rats. Both the analytes and IS were found to be stable in all the above stability conditions (Table 6). Thus, the results of the stability experiment justify the techniques by which the samples were processed for further application.
Table 6. Stability at LQC and HQC Levels of DEM and DEX in Rat Plasma (n = 6).
| stability | analyte | nominal conc. (ng/mL) | calculated conc. (ng/mL) | precision (% CV) | % difference |
|---|---|---|---|---|---|
| benchtop stability (19 h and 28 min) | DEM | 0.58 | 0.59 ± 0.05 | 8.47 | 5.29 |
| 302.52 | 300.16 ± 11.76 | 3.92 | –0.36 | ||
| DEX | 0.30 | 0.29 ± 0.02 | 6.9 | 0.00 | |
| 156.76 | 153.91 ± 5.91 | 3.84 | –0.70 | ||
| wet extract stability (42 h and 12 min) | DEM | 0.58 | 0.61 ± 0.05 | 8.20 | 8.86 |
| 302.52 | 298.73 ± 10.53 | 3.52 | –0.83 | ||
| DEX | 0.30 | 0.31 ± 0.02 | 6.45 | 6.90 | |
| 156.76 | 153.92 ± 5.87 | 3.81 | –0.69 | ||
| processed sample stability (28 h and 21 min) | DEM | 0.58 | 0.56 ± 0.03 | 5.36 | –0.06 |
| 302.52 | 308.31 ± 8.23 | 2.67 | 2.35 | ||
| DEX | 0.30 | 0.030 ± 0.01 | 3.33 | 3.45 | |
| 156.76 | 151.91 ± 3.03 | 1.99 | –1.99 | ||
| freeze thaw stability (five cycles) | DEM | 0.58 | 0.57 ± 0.03 | 5.26 | 1.72 |
| 302.52 | 293.62 ± 16.24 | 5.53 | –2.53 | ||
| DEX | 0.30 | 0.30 ± 0.02 | 6.67 | 3.45 | |
| 156.76 | 156.02 ± 1.22 | 0.78 | 0.66 | ||
| autosampler stability (64 h and 3 min) | DEM | 0.58 | 0.58 ± 0.03 | 5.17 | 3.51 |
| 302.52 | 308.23 ± 7.69 | 2.49 | 2.32 | ||
| DEX | 0.30 | 0.28 ± 0.02 | 7.14 | –3.45 | |
| 156.76 | 149.71 ± 5.67 | 3.79 | –3.41 | ||
| long-term stability (49 days) | DEM | 0.58 | 0.58 ± 0.03 | 5.17 | 3.51 |
| 302.52 | 299.62 ± 9.41 | 3.14 | –0.54 | ||
| DEX | 0.30 | 0.30 ± 0.02 | 6.67 | 3.45 | |
| 156.76 | 155.49 ± 7.51 | 4.83 | 0.32 |
3.4. Pharmacokinetic Study
The compound-dependent parameters were optimized (Table S1), and the method was found to be selective for determining DEM and DEX when administered with TCE. Based on this suitability, the current LC-MS/MS method investigated pharmacokinetic-mediated drug interaction between DEM and TCE. Earlier, we demonstrated that 30–60 min of incubation with TCE is necessary to inhibit the metabolic enzymes in vitro.16 Thus, TCE was administered 2 h before the administration of DEM. This was also necessary to minimize any absorption-mediated drug interaction. Although QN is coadministered with DEM, in the current study, QN was administered 2 h before the use of DEM for comparison with TCE.
The major pharmacokinetic parameters including Cmax, Tmax, AUC, MRT, t1/2, and CL/F_obs of DEM and its metabolite DEX were presented for group A and B studies in Tables 7 and 8, respectively. Considering that inhibition of DEM metabolism can lead to an increase in DEM levels along with a decrease in DEX levels, the DEMAUC/DEXAUC ratio was calculated and used as a parameter to suggest a metabolism-mediated interaction. While no significant (p < 0.01) changes were observed in pharmacokinetic parameters like Cmax, Tmax, AUC, MRT, and t1/2 of group A-2 in comparison to group A-1, a significant (p < 0.01) decrease in CL/F_obs was observed. Similar observations were also made in Grp 3 animals treated with a higher dose of TCE (400 mg/kg). Although this suggests the ability of TCE (100 mg/kg) to increase circulation of DEM following single-dose administration, it failed to produce a significantly higher DEMAUC/DEXAUC (Figure 4 A,B and Table 7). This suggests that the extent of metabolism of DEM by a single dose of TCE did not produce a change in the pharmacokinetic parameters of DEM.
Table 7. Pharmacokinetic Parameters of DEM and DEX after Single Oral Administration (n = 6, Mean± SD).
| group A-1 QN + DEM |
group A-2 TCE (100 mg) + DEM |
group A-3 TCE (400 mg) + DEM |
||||
|---|---|---|---|---|---|---|
| parameters | DEM | DEX | DEM | DEX | DEM | DEX |
| AUC(0→t) ng/mL·h | 125.61 ± 13.22 | 53.91 ± 11.87 | 226.35 ± 61.33 | 65.92 ± 32.64 | 149.41 ± 25.75 | 53.36 ± 23.83 |
| AUC(0→∞) ng/mL·h | 128.45 ± 12.21 | 56.86 ± 11.77 | 231.36 ± 62.43 | 74.54 ± 38.77 | 156.04 ± 25.03 | 60.21 ± 26.76 |
| Cmax (ng/mL) | 49.54 ± 14.60 | 22.13 ± 6.01 | 71.76 ± 13.64 | 19.90 ± 10.94 | 76.73 ± 9.95 | 26.53 ± 14.74 |
| Tmax (h) | 0.43 ± 0.23 | 0.46 ± 0.10 | 0.51 ± 0.29 | 0.47 ± 0.22 | 0.49 ± 0.36 | 0.46 ± 0.19 |
| Kel | 0.27 ± 0.12 | 0.13 ± 0.05 | 0.20 ± 0.06 | 0.10 ± 0.04 | 0.31 ± 0.11 | 0.19 ± 0.08 |
| t1/2 (h) | 2.55 ± 0.89 | 5.98 ± 1.97 | 3.73 ± 1.09 | 8.25 ± 3.45 | 2.39 ± 0.67 | 4.51 ± 2.62 |
| CL/F (L/h) | 0.04 ± 0.00 | 0.09 ± 0.02 | 0.02 ± 0.01a | 0.08 ± 0.04 | 0.03 ± 0.01a | 0.09 ± 0.03 |
| MRT(0→t) (h) | 3.03 ± 1.04 | 4.09 ± 0.72 | 3.68 ± 0.46 | 4.86 ± 0.95 | 2.43 ± 0.54 | 3.23 ± 1.30 |
| MRT(0→∞) (h) | 3.44 ± 1.19 | 5.41 ± 1.07 | 4.10 ± 0.49 | 8.01 ± 3.00 | 2.91 ± 0.82 | 5.05 ± 2.34 |
| AUC(0→∞) DEM/DEX | 2.26 | 3.10 | 2.59 | |||
P < 0.01: group A-2 compared to A-1, *P < 0.01: group A-3 compared to A-1.
Table 8. Pharmacokinetic Parameters of DEM and DEX for Multiple Doses, 14 Days (n = 6, Mean ± SD).
| group B-1 QN + DEM |
group B-2 TCE (100 mg) + DEM |
group B-3 TCE (400 mg) + DEM |
||||
|---|---|---|---|---|---|---|
| parameters | DEM | DEX | DEM | DEX | DEM | DEX |
| AUC(0→t) ng/mL·h | 102.90 ± 11.76 | 40.04 ± 22.25 | 196.63 ± 37.76a | 27.10 ± 01.95 | 2301.80 ± 733.42a | 189.64 ± 117.30 |
| AUC (0→∞) ng/mL·h | 106.16 ± 10.62 | 42.04 ± 22.63 | 199.66 ± 37.69a | 28.52 ± 1.51 | 2341.86 ± 748.45a | 251.30 ± 138.21 |
| Cmax (ng/mL) | 72.42 ± 12.14 | 17.33 ± 10.11 | 76.73 ± 09.95 | 10.93 ± 00.52 | 360.50 ± 113.41a | 46.88 ± 26.66 |
| Tmax (h) | 0.11 ± 0.07 | 0.63 ± 0.21 | 0.08 ± 0.00 | 0.67 ± 0.20 | 0.96 ± 0.10a | 0.63 ± 0.21 |
| Kel | 0.36 ± 0.05 | 0.33 ± 0.03 | 0.23 ± 0.06a | 0.30 ± 0.02 | 0.25 ± 0.02a | 0.14 ± 0.08 |
| t1/2 (h) | 1.97 ± 0.30 | 2.12 ± 0.19 | 3.15 ± 0.84a | 2.32 ± 0.17 | 2.81 ± 0.25a | 5.74 ± 1.93 |
| CL/F (L/h) | 0.05 ± 0.01 | 0.15 ± 0.74 | 0.03 ± 0.01a | 0.18 ± 0.01 | 0.00 ± 0.00a | 0.03 ± 0.01 |
| MRT(0→t) (h) | 2.09 ± 0.51 | 2.56 ± 0.09 | 3.39 ± 0.52a | 2.79 ± 0.08 | 5.24 ± 1.41a | 4.13 ± 0.96 |
| MRT(0→∞) (h) | 2.44 ± 0.68 | 3.13 ± 0.28 | 3.74 ± 0.83a | 3.32 ± 0.27 | 5.45 ± 1.29a | 7.77 ± 3.00 |
| AUC(0→t) DEM/DEX | 2.57 | 7.26 | 12.14 | |||
P < 0.01: group B-2 compared to B-1, *P < 0.01: group B-3 compared to B-1.
Figure 4.

Mean plasma concentration–time curves of DEM (A), DEX (B) in rats after a single pretreatment (A-1, A-2, and A-3 administered with QN-2.5 mg/kg, TCE-100 mg/kg, and TCE-400 mg/kg, respectively) followed by single oral administration of DEM (5 mg/kg). DEM (C) and DEX (D) in rats after multiple pretreatment for 14 days (B-1, B-2, and B-3 administered with QN-2.5 mg/kg, TCE-100 mg/kg, and TCE-400 mg/kg, respectively) followed by single oral administration of DEM (5 mg/kg).
A 14-day multiple-dosing study was used to demonstrate the metabolism-mediated drug interaction of TCE.18 Moreover, the multiple-dose study is more relevant to show metabolism/pharmacokinetic-mediated drug interaction for drugs used for long-term application.18 Accordingly, 14-day multiple-dosing studies were conducted in group B animals (Figure 4C,D and Table 8). A significant (p < 0.01) increase in AUC and MRT of DEM following the use of 100 mg/kg of TCE demonstrated the ability of TCE to increase the bioavailability of DEM compared to QN significantly. The Cmax and Tmax at this dose (group B2) were similar to those of group B-1. This supports that the pharmacokinetic interaction is not absorption-mediated and suggests that keeping a 2 h gap between oral administration of TCE and DEM has minimized possibilities for absorption-mediated drug interaction. The clearance of DEM at this dose was significantly lowered. This was also accompanied by a 2.8-fold increase of DEMAUC/DEXAUC compared to group B-1 (Table 8). This indicates that the increase in bioavailability of DEM can be partly attributed to the metabolism-mediated interaction between TCE and DEM.
Furthermore, significant increases in AUC, MRT, and t1/2 and a decrease in Kel and Cl were observed in group B-3 with respect to group B-1, leading to a 4.7-fold increase in DEMAUC/DEXAUC. Higher bioavailability of DEM with an increase in dose is in agreement with the work of Marier et al., who reported a rise in DEMAUC/DEXAUC in a dose-dependent manner following coadministration with QN.9 This can be partly related to the inhibition of the metabolism of DEM and suggests that multiple pretreatments of 400 mg/kg TCE cause relatively higher enhancement in bioavailability of DEM compared to the 100 mg/kg dose of TCE. Interestingly, a significant increase in Cmax and Tmax was observed in group B-3. Thus, there might be some absorption-mediated interaction at higher doses. The involvement of multiple mechanisms for herb–drug interaction poses the risk of unpredictability.39 Hence, increasing the dose of TCE to achieve a higher DEMAUC/DEXAUC should be thoroughly investigated to optimize its utility as a complementary therapy. Nonetheless, the No-Observed-Adverse-Effect-Level (NOAEL) of TCE is reported to be 1000 mg/kg/day and there is scope for its application at lower doses.40 Moreover, TCE has been demonstrated to improve the cognitive functions related to AD in a preclinical model.41 However, this is yet to be clinically validated.
3.5. Network Pharmacology of TCE for Targets of AD
More preclinical and clinical studies are necessary to establish the mode of action of TCE to justify its suitability for application against AD as a standalone or complementary therapy. Nonetheless, network pharmacology has been used as a tool to have a preliminary idea about the possible modes of action of herbal drugs.42 Accordingly, this technique was used in the current study. The phytocomponents of TCE that are expected to have brain access were found to have potential to interact with 45 targets (Figure 5). Out of these, 10 targets were found to be associated with AD. These targets are involved in multiple pathways (Figure S5A) and are categorized according to Gene Ontology (Figure S5B–D). Therefore, protein–protein interactions were studied that led to identification of SLC6A3, BCHE, ESR1, ESR2, and MAOB as hub targets (Figure 6A). Although SLC6A3 is a dopamine transporter gene, it has been implicated in several neuropsychiatric diseases.43 Besides, its abnormal expression has been associated with symptoms of AD.44 While ESR1 and ESR2 genes are associated with increased risk of AD,45 MAOB elevation is a characteristic of AD.46 Furthermore, higher BChE activity is reported with AD.47 The analysis of the compound-target-pathway network reveals that compounds 4840 (piperine) and 162912526 (smilar to tinocordifolin) have potential for interaction with MAOB (Figure 6B). This is in agreement with the fact that piperine has a low IC50 value (7.0 μm) for MAOB.48 This also shows that eight compounds can possibly modulate SLC6A3. Besides, strong interaction was also predicted for these compounds with ESR1, ESR2, and BCHE. This indicates that TCE components have potential to interact with multiple targets associated with AD. However, further experimental validation is necessary to support this.
Figure 5.
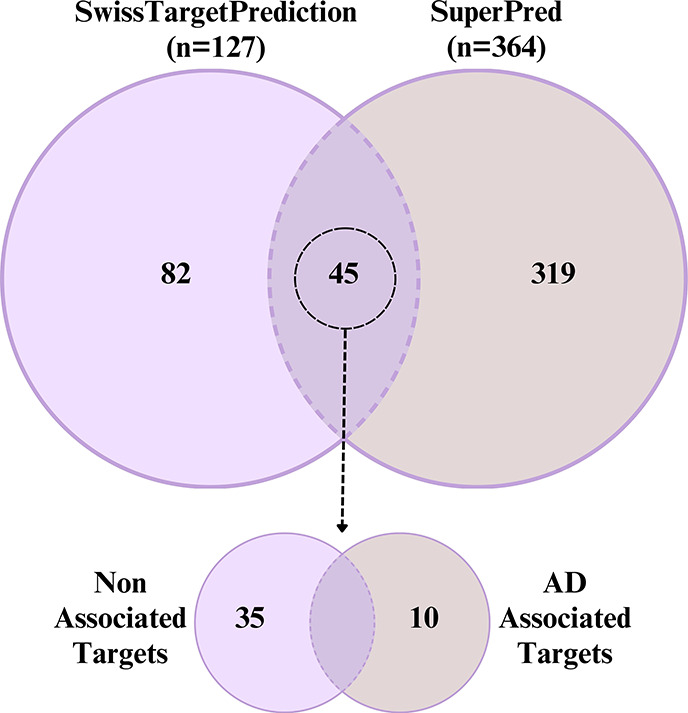
Venn diagram illustrating the intersection of the predicted potential targets by SwissTargetPrediction and SuperPred database of Tinospora cordifolia phytoconstituents. The 45 joint targets further shown into Alzheimer’s disease (AD) associated and nonassociated as indicated by gene–disease association analysis from DisGeNET.
Figure 6.

Target–target and compound–target–pathway networks constructed by STRING and Cytoscape. (A) Target–target network. (B) Compound–target–pathway network. The color of each eclipse in the target–target network represents the degree of the node. The thickness of the edges in both networks represents the confidence score. The label of the compound’s node denoted the PubChem CID.
3.6. Effect on Scopolamine-Induced Dementia
Scopolamine is known to impair memory in rodents through multiple etiologies. Although details of all these mechanisms are not clearly elucidated, scopolamine is known to block cholinergic response of acetylcholine, which is known to cause AD-related cognitive impairment.49 Furthermore, it induces oxidative stress associated with dementia.28 Accordingly, control animals that did not receive any treatment showed signs of cognitive impairment with increase in the transfer latency in the rectangular maze (Figure 7A). As expected, combination of DEM and QN significantly (p < 0.001) reduced the scopolamine-induced transfer latency. Although TCE alone failed to decrease this significantly during initial period, beyond 7 days, the effect was significant (p < 0.001). Interestingly, the effect of the combination of TCE and DEM was significantly (p < 0.05) higher than the standard group during this period. This suggests the relatively higher ability of the TCE and DEM combination to improve spatial memory as compared to the combination of DEM and QN.
Figure 7.

Effects of different test compounds on scopolamine-induced memory impairment in rats on (A) rectangular maze and (B) open field tests. Values are represented as mean ± SEM from six animals and were analyzed using a one-way ANOVA accompanied by a Student t test. **p < 0.01 and ***p < 0.001 show the comparison between the scopolamine-control versus the treatment groups.
Loss of spatial memory is associated with hyperactivity in rodents.50 Thus, the locomotor and exploratory behaviors of the rats were measured by the open field test. The control, standard, and test group animals showed similar number of peripheral squares crossing on day 1 (Figure 7B). TCE alone showed less decrease in this as compared with the standard. However, when combined with DEM, the effect was better than that of the standard (Figure 7B). Thus, complementary use of TCE with DEM was found to improve spatial memory and reduce hyperactivity in rodents. Interestingly, the effect was better than that of the combination of QN and DEM.
To support the behavioral studies, histopathological structures of the hippocampus region were observed in all four groups of test animals. The brain of the control animal showed hypertrophic cells (Figure 8). There were proliferations of glial cells indicating impairment. Additionally, spongiosis of the matrix with fluid-filled spaces were observed indicating perivascular edema. This was found to be rectified in the brain of animals of test groups. The outline of the hippocampal region was clear in these groups, and cells appear normal. This suggests that treatment with TCE and/or DEM has prevented tissue degeneration in the hippocampal region of the brain.
Figure 8.

Photomicrograph showing the histopathology of the hippocampal region from a rat’s brain stained by eosin and hematoxylin at 100× magnification. (A) Scopolamine-induced dementia rat exhibits gliosis and spongiosis in the hippocampus region. (B) Scopolamine-induced demented rat treated with 2.5 mg/kg quinidine and, after 2 h, with 5 mg/kg dextromethorphan showed a reduction in diffuse gliosis and the presence of distinct hippocampal linings. (C, D) Scopolamine-induced demented rat treated with Tinospora cordifolia extract at 400 mg/kg, demonstrating protection against hippocampus damage with clear border cell lining and similar hippocampal architecture, as well as prevention of gliosis and spongiosis.
These findings are in agreement with prior works that demonstrated the ability of TCE to improve cognitive functions.18,41 Although most of these studies have used TCE up to 200 mg/kg in rodents, a dose of 400 mg/kg was used in this study taking into consideration the higher bioavailability of DEM at this dose. Also, TCE is reported to show highest protection at this dose against inflammation, which is involved in the progression of AD.51 Moreover, 2000 mg/kg of TCE is demonstrated to be safe in rodents.51 Thus, further studies at different doses can be investigated to optimize doses for complementary benefits with DEM. Also, toxicokinetic studies are necessary to validate the safety. Nonetheless, this furthers traditional application of TCE as rejuvenator13 and supports its potential application for management of dementia.14
4. Conclusions
The study revealed that TCE coadministration enhanced the bioavailability of DEM through significant enhancement in the DEM/DEX ratio following multiple dosing. This was significantly higher than the effect of QN. This led to enhanced efficacy against the progression of dementia. Besides enhancing the bioavailability of DEM, TCE may have potential to contribute to the efficacy against dementia through interactions with multiple targets associated with AD. Thus, the current study can encourage further research for the potential application of TCE as a complementary therapy to DEM.
Acknowledgments
The authors acknowledge the management of Vitely Bio LLP, Ahmedabad, Gujrat, India-380054 and Dean, School of Pharmaceutical Sciences, Siksha ‘O’ Anusandhan (Deemed to be University), Bhubaneswar, India, for providing the facility for the completion of this work. M.G. was supported by fellowship from the Department of Biotechnology (DBT), Ministry of Science and Technology, New Delhi, India (Grant Id: BT/INF/22/SP45078/2022). The authors would like to acknowledge the Indian Council of Medical Research (ICMR), Ministry of Health & Family Welfare, New Delhi, India (Grant Id: AMR/DHR/GIA/4/ECD-II-2020), for providing high-performance computational resources for this study.
Glossary
Abbreviation
- AD
Alzheimer’s disease
- ADMET
absorption, distribution, metabolism, excretion and toxicity
- ANOVA
analysis of variance
- API
atmospheric pressure ionization
- AUC
area under the curve
- BBB
blood–brain barrier
- CAD
collisionally activated dissociation
- CC
calibration curve
- CE
collision energy
- CL
drug clearance
- CL/F_obs
total body clearance for extravascular administration
- Cmax
maximum drug plasma concentration
- CNS
central nervous system
- CUR
curtain gas
- CV
coefficient of variation
- CXP
collision cell exit potential
- CYP
cytochrome P450
- DEM
dextromethorphan
- DEX
dextrorphan
- DP
declustering potential
- EP
entrance potential
- ESI
electrospray ionization
- FDR
false discovery rate
- GDA
gene–disease association
- GO
gene ontology
- GS1
nebulizing gas
- GS2
drying gas
- HPLC
high-performance liquid chromatography
- HQC
higher quality control
- IS
ion spray voltage
- KEGG
Kyoto Encyclopedia of Genes and Genomes
- LC-MS/MS
liquid chromatography with tandem mass spectrometry
- LLOQ
lower limit of quantitation
- LQC
lower quality control
- m/z
mass-overcharge ratio
- MF
matrix factor
- MM/GBSA
molecular mechanics with generalized Born and surface area solvation
- MQC
middle-quality control
- MRM
multiple reaction monitoring
- MRT
mean residence time
- NMDARs
N-methyl-d-aspartate (NMDA) receptors
- PDB
Protein Data Bank
- PPI
protein–protein interaction
- QC
quality control
- QN
quinidine
- RIT
ritonavir
- RT
retention time
- RTZ
thioridazine
- S/N
signal-to-noise
- SAS
Statistical Analysis Software
- SD
standard deviation
- SMILES
simplified molecular input line-entry system
- SPE
solid phase extraction
- t1/2
biological half-life
- TCE
Tinospora cordifolia stem extract
- Tmax
maximum peak time
- UPLC-MS/MS
ultraperformance liquid chromatography–mass spectrometry
- XP
extra precision
- IC50
concentration that inhibits by 50%
Supporting Information Available
The Supporting Information is available free of charge at https://pubs.acs.org/doi/10.1021/acsomega.4c01219.
Structure of dextromethorphan, dextrorphan, quinidine, dextromethorphan d3 and dextrorphan d3 (Figure S1), workflow of the methodology (Figure S2); Q1 scan of TCE phytompounds inhibiting CYP (Figure S3); product ion scan of berberine, jatrorrhzine, and palmatine (Figure S4); functional pathway and gene ontology enrichment analysis of Alzheimer disease-associated genes (Figure S5); compound-dependent parameters for analytes and internal standards (Table S1); phytocomponents of TCE with high bioavailability and ability to inhibit CYP enzymes (Table S2); and compounds predicted with high gastrointestinal absorption, BBB permeability, and no violations of Lipinski’s rule of five (Table S3) (PDF)
Author Contributions
Conceptualization: P.K.M., R.S., B.B.S.; formal analysis: P.K.M., M.G., R.S., S.T., G.G., B.B.S.; investigation: P.K.M., S.S., M.G., G.K., S.R., S.T.; methodology: P.K.M., R.S., B.B.S.; supervision: G.G., B.B.S.; visualization: P.K.M., S.S., M.G., G.K., S.R., R.S., P.K.P.; writing—original draft: P.K.M., M.G., G.G., B.B.S.; writing—review and editing: P.K.M., B.B.S. The manuscript has been read and approved by all named authors.
The authors declare no competing financial interest.
Supplementary Material
References
- Taylor C. P.; Traynelis S. F.; Siffert J.; Pope L. E.; Matsumoto R. R. Pharmacology of Dextromethorphan: Relevance to Dextromethorphan/Quinidine (Nuedexta®) Clinical Use. Pharmacol. Ther. 2016, 164, 170–182. 10.1016/j.pharmthera.2016.04.010. [DOI] [PubMed] [Google Scholar]
- Wang R.; Reddy P. H. Role of Glutamate and NMDA Receptors in Alzheimer’s Disease. J. Alzheimers. Dis. 2017, 57 (4), 1041–1048. 10.3233/JAD-160763. [DOI] [PMC free article] [PubMed] [Google Scholar]
- Woodworth J. R.; Dennis S. R.; Moore L.; Rotenberg K. S. The Polymorphic Metabolism of Dextromethorphan. J. Clin. Pharmacol. 1987, 27 (2), 139–143. 10.1002/j.1552-4604.1987.tb02174.x. [DOI] [PubMed] [Google Scholar]
- Kazis A.; Kimiskidis V.; Niopas I. Pharmacokinetics of Dextromethorphan and Dextrorphan in Epileptic Patients. Acta Neurol. Scand. 1996, 93 (2–3), 94–98. 10.1111/j.1600-0404.1996.tb00181.x. [DOI] [PubMed] [Google Scholar]
- Steinberg G. K.; Bell T. E.; Yenari M. A. Dose Escalation Safety and Tolerance Study of the N-Methyl-D-Aspartate Antagonist Dextromethorphan in Neurosurgery Patients. J. Neurosurg. 1996, 84 (5), 860–866. 10.3171/jns.1996.84.5.0860. [DOI] [PubMed] [Google Scholar]
- Lutz J. D.; Isoherranen N. Prediction of Relative in Vivo Metabolite Exposure from in Vitro Data Using Two Model Drugs: Dextromethorphan and Omeprazole. Drug Metab. Dispos. 2012, 40 (1), 159–168. 10.1124/dmd.111.042200. [DOI] [PMC free article] [PubMed] [Google Scholar]
- Tampi R. R.; Joshi P.; Marpuri P.; Tampi D. J. Evidence for Using Dextromethorphan-Quinidine for the Treatment of Agitation in Dementia. World J. psychiatry 2020, 10 (4), 29–33. 10.5498/wjp.v10.i4.29. [DOI] [PMC free article] [PubMed] [Google Scholar]
- Yu A.; Haining R. L. Comparative Contribution to Dextromethorphan Metabolism by Cytochrome P450 Isoforms in Vitro: Can Dextromethorphan Be Used as a Dual Probe for Both CYP2D6 and CYP3A Activities?. Drug Metab. Dispos. 2001, 29 (11), 1514–1520. [PubMed] [Google Scholar]
- Marier J. F.; Pope L. E.; Yakatan G. J.; Berg J. E.; Stiles M.; Vachon P. Influence of Concomitant Quinidine Administration on Dextromethorphan Disposition in Rats. J. Vet. Pharmacol. Ther. 2004, 27 (2), 111–114. 10.1111/j.1365-2885.2004.00559.x. [DOI] [PubMed] [Google Scholar]
- Thomas S. H. L.; Behr E. R. Pharmacological Treatment of Acquired QT Prolongation and Torsades de Pointes. Br. J. Clin. Pharmacol. 2016, 81 (3), 420–427. 10.1111/bcp.12726. [DOI] [PMC free article] [PubMed] [Google Scholar]
- Yu A.; Haining R. L. Comparative Contribution to Dextromethorphan Metabolism by Cytochrome P450 Isoforms in Vitro: Can Dextromethorphan Be Used as a Dual Probe for Both CTP2D6 and CYP3A Activities?. Drug Metab. Dispos. 2001, 29 (11), 1514–1520. [PubMed] [Google Scholar]
- Nielsen T. L.; Rasmussen B. B.; Flinois J. P.; Beaune P.; Brosen K. In vitro metabolism of quinidine: The 3S)-3-hydroxylation of quinidine is a specific marker reaction for cytochrome P-4503A4 activity in human liver microsomes. J. Pharmacol. Exp. Ther. 1999, 289 (1), 31–37. [PubMed] [Google Scholar]
- Arya Vaidya, Sala (Kottakkal, I. Indian medicinal plants: a compendium of 500 species. Vol. 4. 1997.
- Vinutha B.; Prashanth D.; Salma K.; Sreeja S. L.; Pratiti D.; Padmaja R.; Radhika S.; Amit A.; Venkateshwarlu K.; Deepak M. Screening of Selected Indian Medicinal Plants for Acetylcholinesterase Inhibitory Activity. J. Ethnopharmacol. 2007, 109 (2), 359–363. 10.1016/j.jep.2006.06.014. [DOI] [PubMed] [Google Scholar]
- Arunachalam K.; Yang X.; San T. T. Tinospora cordifolia (Willd.) Miers: Protection Mechanisms and Strategies against Oxidative Stress-Related Diseases. J. Ethnopharmacol. 2022, 283, 114540 10.1016/j.jep.2021.114540. [DOI] [PubMed] [Google Scholar]
- Sahu R.; Ahmed T.; Sangana R.; Punde R.; Subudhi B. B. Effect of Tinospora cordifolia Aqua-Alcoholic Extract on Pharmacokinetic of Glibenclamide in Rat: An Herb-Drug Interaction Study. J. Pharm. Biomed. Anal. 2018, 151, 310–316. 10.1016/j.jpba.2018.01.010. [DOI] [PubMed] [Google Scholar]
- Bhalodi K.; Kothari C. S. Tinospora cordifolia: A New Perspective on Alzheimer’s Disease and Green Nanotechnology. Nat. Prod. J. 2023, 13 (2), 26. 10.2174/2210315512666220523123836. [DOI] [Google Scholar]
- Sharma A.; Kaur G. Tinospora cordifolia as a Potential Neuroregenerative Candidate against Glutamate Induced Excitotoxicity: An in Vitro Perspective. BMC Complement. Altern. Med. 2018, 18 (1), 268. 10.1186/s12906-018-2330-6. [DOI] [PMC free article] [PubMed] [Google Scholar]
- Sharma P.; Dwivedee B. P.; Bisht D.; Dash A. K.; Kumar D. The Chemical Constituents and Diverse Pharmacological Importance of Tinospora cordifolia. Heliyon 2019, 5 (9), e02437 10.1016/j.heliyon.2019.e02437. [DOI] [PMC free article] [PubMed] [Google Scholar]
- Majhi P. K.; Sayyad S.; Mishra P.; Kamte S.; Sahu R.; Ghosh G.; Subudhi B. B. Low-Volume Plasma Sampling for Determination of Dextromethorphan and Dextrorphan in Rat Plasma: LC-MS/MS Method and Its Application in Pharmacokinetic Study. Biomed. Chromatogr. 2023, 37 (4), e5588 10.1002/bmc.5588. [DOI] [PubMed] [Google Scholar]
- Singh D.; Chaudhuri P. K. Chemistry and Pharmacology of Tinospora cordifolia. Nat. Prod. Commun. 2017, 12 (2), 299–308. 10.1177/1934578X1701200240. [DOI] [PubMed] [Google Scholar]
- Kidwai A. R.; Salooja K. C.; Sharma V. N.; Siddiqui S. Chemical Examination of Tinospora cordifolia. J. Sci. Indian Res. 1949, 8, 115–118. [Google Scholar]
- Namrata C.; M.B S.; Shazia A.; Sayyada K. Tinospora cordifolia: Ethnobotany, Phytopharmacology and Phytochemistry Aspects. Int. J. Pharm. Sci. Res. 2013, 53 (9), 891–899. [Google Scholar]
- Daina A.; Michielin O.; Zoete V. SwissADME: A Free Web Tool to Evaluate Pharmacokinetics, Drug-Likeness and Medicinal Chemistry Friendliness of Small Molecules. Sci. Rep. 2017, 7 (1), 1–13. 10.1038/srep42717. [DOI] [PMC free article] [PubMed] [Google Scholar]
- Xiong G.; Wu Z.; Yi J.; Fu L.; Yang Z.; Hsieh C.; Yin M.; Zeng X.; Wu C.; Lu A.; Chen X.; Hou T.; Cao D. ADMETlab 2.0: An Integrated Online Platform for Accurate and Comprehensive Predictions of ADMET Properties. Nucleic Acids Res. 2021, 49 (W1), W5–W14. 10.1093/nar/gkab255. [DOI] [PMC free article] [PubMed] [Google Scholar]
- Yang H.; Lou C.; Sun L.; Li J.; Cai Y.; Wang Z.; Li W.; Liu G.; Tang Y. AdmetSAR 2.0: Web-Service for Prediction and Optimization of Chemical ADMET Properties. Bioinformatics 2019, 35 (6), 1067–1069. 10.1093/bioinformatics/bty707. [DOI] [PubMed] [Google Scholar]
- Schyman P.; Liu R.; Desai V.; Wallqvist A. VNN Web Server for ADMET Predictions. Front. Pharmacol. 2017, 8 (DEC), 1–14. 10.3389/fphar.2017.00889. [DOI] [PMC free article] [PubMed] [Google Scholar]
- Pushpalatha B.; Venumadhav N.; Swathi M.; Raju B. Neuroprotective Effect of Resveratrol against Scopolamine-Induced Cognitive Impairment and Oxidative Stress in Rats. Arch. Biol. Sci. 2013, 65 (4), 1381–1386. 10.2298/ABS1304381P. [DOI] [Google Scholar]
- Yadang F. S. A.; Nguezeye Y.; Kom C. W.; Betote P. H. D.; Mamat A.; Tchokouaha L. R. Y.; Taiwé G. S.; Agbor G. A.; Bum E. N. Scopolamine-Induced Memory Impairment in Mice: Neuroprotective Effects of Carissa Edulis (Forssk.) Valh (Apocynaceae) Aqueous Extract. Int. J. Alzheimers. Dis. 2020, 2020, 6372059. 10.1155/2020/6372059. [DOI] [PMC free article] [PubMed] [Google Scholar]
- Kato H. Computational Prediction of Cytochrome P450 Inhibition and Induction. Drug Metab. Pharmacokinet. 2020, 35 (1), 30–44. 10.1016/j.dmpk.2019.11.006. [DOI] [PubMed] [Google Scholar]
- Genheden S.; Ryde U. The MM/PBSA and MM/GBSA Methods to Estimate Ligand-Binding Affinities. Expert Opin. Drug Discovery 2015, 10 (5), 449–461. 10.1517/17460441.2015.1032936. [DOI] [PMC free article] [PubMed] [Google Scholar]
- Salentin S.; Schreiber S.; Haupt V. J.; Adasme M. F.; Schroeder M. PLIP: Fully Automated Protein-Ligand Interaction Profiler. Nucleic Acids Res. 2015, 43, W443. 10.1093/nar/gkv315. [DOI] [PMC free article] [PubMed] [Google Scholar]
- Wang A.; Stout C. D.; Zhang Q.; Johnson E. F. Contributions of Ionic Interactions and Protein Dynamics to Cytochrome P450 2D6 (CYP2D6) Substrate and Inhibitor Binding. J. Biol. Chem. 2015, 290 (8), 5092–5104. 10.1074/jbc.M114.627661. [DOI] [PMC free article] [PubMed] [Google Scholar]
- Sevrioukova I. F.; Poulos T. L. Structure and Mechanism of the Complex between Cytochrome P4503A4 and Ritonavir. Proc. Natl. Acad. Sci. U. S. A. 2010, 107 (43), 18422–18427. 10.1073/pnas.1010693107. [DOI] [PMC free article] [PubMed] [Google Scholar]
- Su C.-R.; Ueng Y.-F.; Nguyen X. D.; Reddy M. V. B.; Wu T.-S. Cytochrome P3A4 Inhibitors and Other Constituents of Fibraurea Tinctoria. J. Nat. Prod. 2007, 70 (12), 1930–1933. 10.1021/np0704248. [DOI] [PubMed] [Google Scholar]
- Guo Y.; Chen Y.; Tan Z. R.; Klaassen C. D.; Zhou H. H. Repeated Administration of berberine Inhibits Cytochromes P450 in Humans. Eur. J. Clin. Pharmacol. 2012, 68 (2), 213–217. 10.1007/s00228-011-1108-2. [DOI] [PMC free article] [PubMed] [Google Scholar]
- Salminen K. A.; Meyer A.; Jerabkova L.; Korhonen L. E.; Rahnasto M.; Juvonen R. O.; Imming P.; Raunio H. Inhibition of Human Drug Metabolizing Cytochrome P450 Enzymes by Plant Isoquinoline Alkaloids. Phytomedicine 2011, 18 (6), 533–538. 10.1016/j.phymed.2010.08.012. [DOI] [PubMed] [Google Scholar]
- Yan R.; Wang Y.; Liu Y.; Di X. Comparative Pharmacokinetics of berberine, palmatine and Jatrorrhizine in Rat Plasma after Oral Administration of Rhizoma Coptidis and Zuojinwan Using Liquid Chromatography-Tandem Mass Spectrometry. Iran. J. Pharm. Res. 2012, 11 (3), 949–957. [PMC free article] [PubMed] [Google Scholar]
- Oga E. F.; Sekine S.; Shitara Y.; Horie T. Pharmacokinetic Herb-Drug Interactions: Insight into Mechanisms and Consequences. Eur. J. Drug Metab. Pharmacokinet. 2016, 41 (2), 93–108. 10.1007/s13318-015-0296-z. [DOI] [PubMed] [Google Scholar]
- Balkrishna A.; Haldar S.; Varshney A. OECD-407 Driven 28-Day-Repeated-Dose Non-Clinical Safety Evaluation of Tinospora cordifolia (Giloy) Stem Aqueous Extract in Sprague-Dawley Rats under GLP Compliance. Front. Pharmacol. 2023, 14, 1095083. 10.3389/fphar.2023.1095083. [DOI] [PMC free article] [PubMed] [Google Scholar]
- Mishra R.; Manchanda S.; Gupta M.; Kaur T.; Saini V.; Sharma A.; Kaur G. Tinospora cordifolia Ameliorates Anxiety-like Behavior and Improves Cognitive Functions in Acute Sleep Deprived Rats. Sci. Rep. 2016, 6, 25564. 10.1038/srep25564. [DOI] [PMC free article] [PubMed] [Google Scholar]
- Lü J.; Zhang D.; Zhang X.; Sa R.; Wang X.; Wu H.; Lin Z.; Zhang B. Network Analysis of the Herb-Drug Interactions of Citrus Herbs Inspired by the “Grapefruit Juice Effect. ACS omega 2022, 7 (40), 35911–35923. 10.1021/acsomega.2c04579. [DOI] [PMC free article] [PubMed] [Google Scholar]
- Reith M. E. A.; Kortagere S.; Wiers C. E.; Sun H.; Kurian M. A.; Galli A.; Volkow N. D.; Lin Z. The Dopamine Transporter Gene SLC6A3: Multidisease Risks. Mol. Psychiatry 2022, 27 (2), 1031–1046. 10.1038/s41380-021-01341-5. [DOI] [PMC free article] [PubMed] [Google Scholar]
- Yang B.; Huang X.; Ruan L.; Yu T.; Li X.; Jesse F. F.; Cao Y.; Li X.; Liu B.; Yang F.; Lee Y.-S.; He L.; Li W.; He G. No Association of SLC6A3 and SLC6A4 Gene Polymorphisms with Schizophrenia in the Han Chinese Population. Neurosci. Lett. 2014, 579, 114–118. 10.1016/j.neulet.2014.07.004. [DOI] [PubMed] [Google Scholar]
- Liu J.; Yuan S.; Niu X.; Kelleher R.; Sheridan H. ESR1 Dysfunction Triggers Neuroinflammation as a Critical Upstream Causative Factor of the Alzheimer’s Disease Process. Aging (Albany. NY). 2022, 14 (21), 8595–8614. 10.18632/aging.204359. [DOI] [PMC free article] [PubMed] [Google Scholar]
- Behl T.; Kaur D.; Sehgal A.; Singh S.; Sharma N.; Zengin G.; Andronie-Cioara F. L.; Toma M. M.; Bungau S.; Bumbu A. G.. Role of Monoamine Oxidase Activity in Alzheimer’s Disease: An Insight into the Therapeutic Potential of Inhibitors. Molecules 2021, 26 ( (12), ). 3724. 10.3390/molecules26123724. [DOI] [PMC free article] [PubMed] [Google Scholar]
- Greig N. H.; Lahiri D. K.; Sambamurti K. Butyrylcholinesterase: An Important New Target in Alzheimer’s Disease Therapy. Int. psychogeriatrics 2002, 14, 77–91. 10.1017/S1041610203008676. [DOI] [PubMed] [Google Scholar]
- Lee S. A.; Hong S. S.; Han X. H.; Hwang J. S.; Oh G. J.; Lee K. S.; Lee M. K.; Hwang B. Y.; Ro J. S. piperine from the Fruits of Piper Longum with Inhibitory Effect on Monoamine Oxidase and Antidepressant-like Activity. Chem. Pharm. Bull. (Tokyo). 2005, 53 (7), 832–835. 10.1248/cpb.53.832. [DOI] [PubMed] [Google Scholar]
- Ferreira-Vieira T. H.; Guimaraes I. M.; Silva F. R.; Ribeiro F. M. Alzheimer’s Disease: Targeting the cholinergic System. Curr. Neuropharmacol. 2016, 14 (1), 101–115. 10.2174/1570159X13666150716165726. [DOI] [PMC free article] [PubMed] [Google Scholar]
- Bardgett M. E.; Baum K. T.; O’Connell S. M.; Lee N. M.; Hon J. C. Effects of Risperidone on Locomotor Activity and Spatial Memory in Rats with Hippocampal Damage. Neuropharmacology 2006, 51 (7–8), 1156–1162. 10.1016/j.neuropharm.2006.07.014. [DOI] [PubMed] [Google Scholar]
- Ghatpande N. S.; Misar A. V.; Waghole R. J.; Jadhav S. H.; Kulkarni P. P. Tinospora cordifolia Protects against Inflammation Associated Anemia by Modulating Inflammatory Cytokines and Hepcidin Expression in Male Wistar Rats. Sci. Rep. 2019, 9 (1), 10969. 10.1038/s41598-019-47458-0. [DOI] [PMC free article] [PubMed] [Google Scholar]
Associated Data
This section collects any data citations, data availability statements, or supplementary materials included in this article.