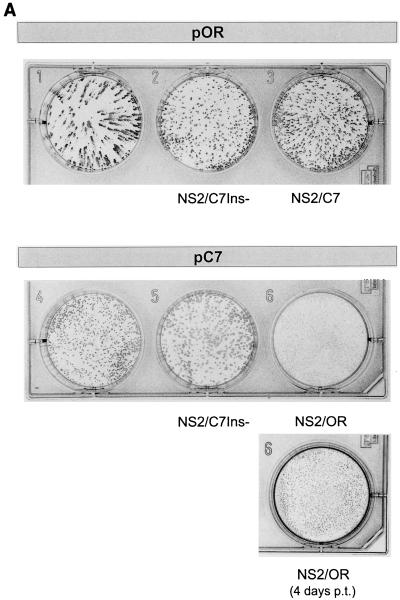
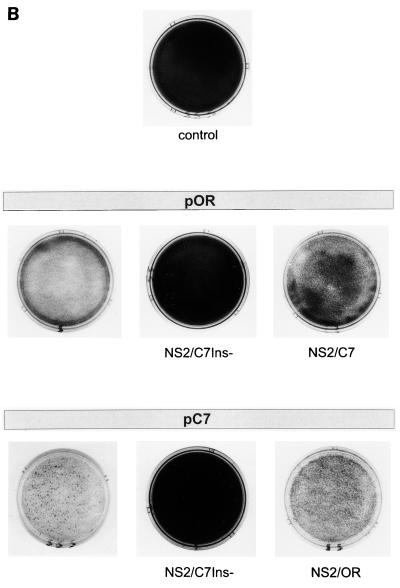
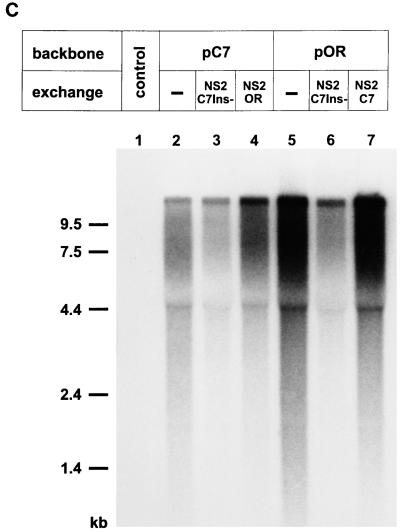
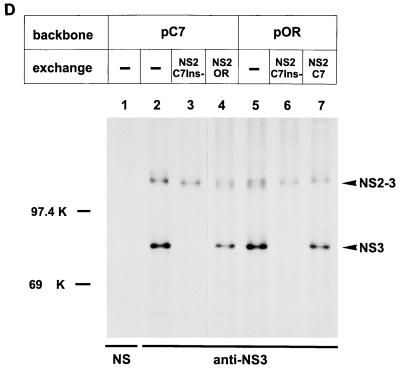
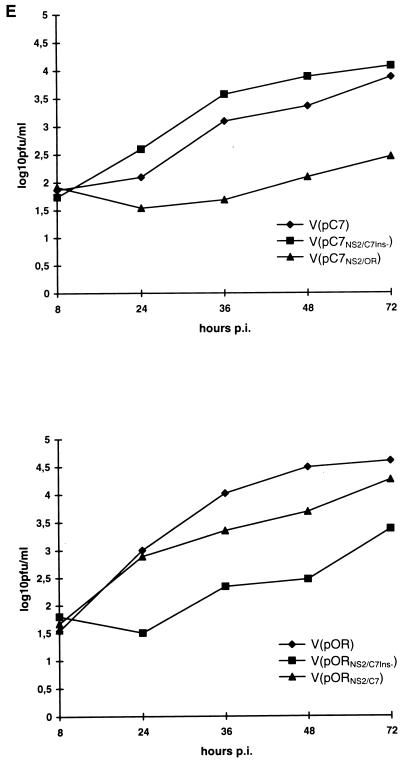
FIG. 3.
Analysis of transfection experiments carried out with RNA transcribed from the parental plasmids pOR and pC7, as well as the chimeric plasmids pORNS2/C7Ins−, pORNS2/C7, pC7NS2/C7Ins−, and pC7NS2/OR. (A) Detection of cells containing replicating virus resulting from RNA transfection. The rows with three dishes show the result of transfection of RNA derived from different full-length constructs based on pOR (upper row) or pC7 (lower row) at 3 days posttransfection. The exchanges present in the constructs are indicated below the dishes. For pC7NS2/OR, a second dish is shown that was fixed 4 days posttransfection (p.t.). Cells were transfected with equal doses of the in vitro-transcribed RNAs by using the DEAE-dextran method and seeded at a sufficient density that 3 days posttransfection a closed layer of cells was obtained. At this time point, cells were fixed and virus-containing cells were visualized by MAb-mediated peroxidase staining. By this means, the ability of the mutants to spread can be judged by the size of the foci. (B) Crystal violet staining of tissue culture cells transfected with RNA transcribed from the indicated plasmids. The arrangement of the dishes is similar to that in panel A. An in vitro-transcribed RNA derived from the ApaI-linearized plasmid pOR which results in a 3′ terminally truncated BVDV genome served as a negative control. Cells were seeded after transfection and split 3 days later. For pC7, crystal violet staining was done 48 h after the first split. The other cells were split again 96 h after the first split. These cells were stained 48 h (pOR, pC7NS2/OR) or 72 h (pORNS2/C7Ins−, pORNS2/C7, pC7NS2/C7Ins−, and control) after the second split. (C) Northern blot with RNA isolated from the transfected cells. The cells were split 72 h posttransfection, and RNA was prepared 48 h after the split. For the noncp viruses, 5 μg of total RNA of the transfected cells was loaded on the gel, whereas for the cp viruses, only 2 μg of RNA was loaded. Hybridization was performed with a BVDV-specific probe. The panel above the gel describes the plasmids from which the different viruses were derived. Interestingly, the recombinant cp viruses seem to produce more viral RNA than the corresponding noncp viruses. Similar results were obtained for a recombinant pair of cp and noncp BVDV obtained from an infectious cDNA clone based on strain NADL (18). (D) SDS-Page analysis of immunoprecipitates after transfection of MDBK cells with RNA derived from the indicated plasmids. Cells were split 72 h posttransfection and labeled with [35S]methionine-[35S]cysteine for 14 h starting either soon after the split (pC7) or 48 h later (pOR, pORNS2/C7Ins−, pORNS2/C7, pC7NS2/C7Ins−, and pC7NS2/OR). Above the gel, the parental full-length clones are indicated; below this is shown the origin of the NS2 gene for the chimeric viruses (the dashes indicate no exchange of sequences). Precipitation was carried out with an anti-NS3 serum (36), which recognizes NS2-3 and NS3, or with a rabbit preimmune serum (NS). (E) Growth curve of the recombinant viruses with heterologous NS2 genes. Cells were infected with the viruses at an MOI of 0.02 and harvested by freezing and thawing at the indicated time points. Titers were determined after infection of new cells by counting the number of plaques 72 h postinfection (p.i.). The results are given as log10 PFU per milliliter.

