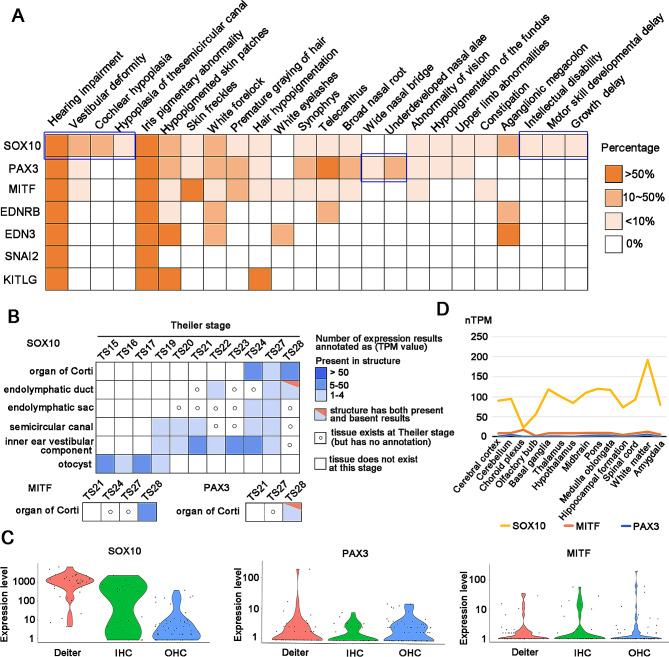
Fig. 6.
The common phenotypes of WS and the expression abundance of genes in ear tissues and brain tissues. (A) The heatmap showed the percentage of 24 common phenotypes in WS. (B) Tissue × stage expression matrix of SOX10, MITF, and PAX3 genes in ear tissues. MGI database only annotates the expression of MITF and PAX3 in the organ of Corti. Compared with PAX3 and MITF, SOX10 was widely and highly expressed in the organ of Corti, semicircular canal, inner ear vestibular component and otocyst. Data is from the MGI database [26]. (C) Violin plot showing gene expression levels of SOX10, MITF, and PAX3 in DCs, IHCs, and OHCs of c3HeB/FeJ mice. The expression level of SOX10 is higher than MITF and PAX3 in cochlear single cells. Data is from the MORL scRNA-Seq database [25]. (D) Line chart showing the expression level of SOX10, PAX3, and MITF in different brain tissues. SOX10 has a higher expression level than MITF and PAX3 in different brain tissues. The yellow, orange and blue lines denote pathogenic genes SOX10, MITF, and PAX3, respectively. Data is from the Human Protein Atlas database [27]

