Fig. 1.
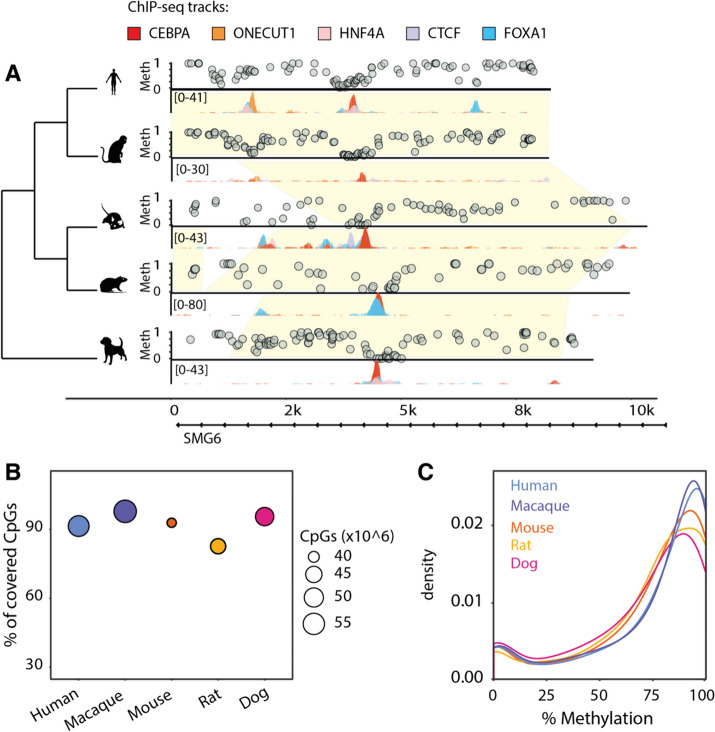
Experimentally mapping methylomes across mammals. A Example region: in vivo 5mC methylation and transcription factor binding around the SMG6 locus in livers isolated from five mammalian species. Yellow shades indicate EPO eutherian mammal alignment blocks (Ensembl version 98). For each species, levels of CpG methylation assayed with bisulfite sequencing are shown above the region, and binding of five transcription factors tracks (CEBPA, CTCF, FOXA1, HNF4A, ONECUT1) assayed through ChIP-sequencing are shown below. B Genomic coverage of WGBS data in each species. The y-axis shows the percentage, while the radius of each point denotes the total number of CpGs covered on the forward and reverse strands. C Genome-wide CpG methylation density distributions for each species. All distributions are bimodal, with the vast majority of CpGs hypermethylated

