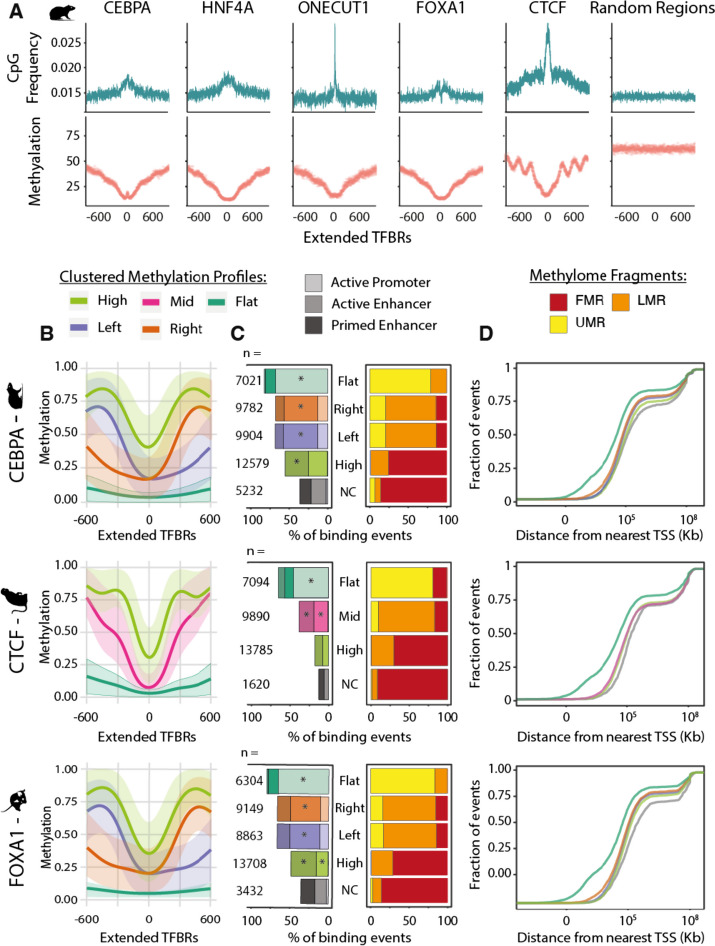
Fig. 3.
Distinct methylation profiles characterize transcription factor binding regions. A Average 5mC and CpG frequency profiles of rat transcription factor binding regions, centered on ChIP-seq peak summits and extended 600 bp on both sides. The number of regions classified in each profile is shown in panel B. B Clustered 5mC profiles for rat CEBPA, mouse FOXA1, and macaque CTCF binding regions centered on ChIP-seq peak summits and normalized to 1200 bp length. The regions have four types of methylation profiles: “flat” in dark green, “left” and “right” in purple and orange, respectively (both referred to as “specular” in the text), “high” in light green and “mid”, which is unique to CTCF, in pink. C Annotations of TF binding regions associated with each clustered methylation profiles defined in panel B. On the right, a bar plot showing the percentage of TF binding events belonging to each methylation profile located within Unmethylated (UMRs), Lowly Methylated (LMRs), or Fully Methylated Regions (FMR) of the genome (yellow, orange, and red, respectively). On the left, the percentage of TF binding events in each 5mC profile that are annotated as active promoters, active enhancers, or primed enhancers. The bars are colored according to the methylation profile assignment of the TFBRs and shaded by regulatory element annotation—lightest for active promoters, darker for active enhancers, and darkest for primed enhancers. Asterisks indicate that the annotation category is significantly enriched (z-test with Bonferroni correction, *p-values < < 0.05). D Cumulative distributions of the distance of each TF binding region from the nearest transcription start site, grouped by methylation profiles defined in panel B. The x axis is in log10 scale

