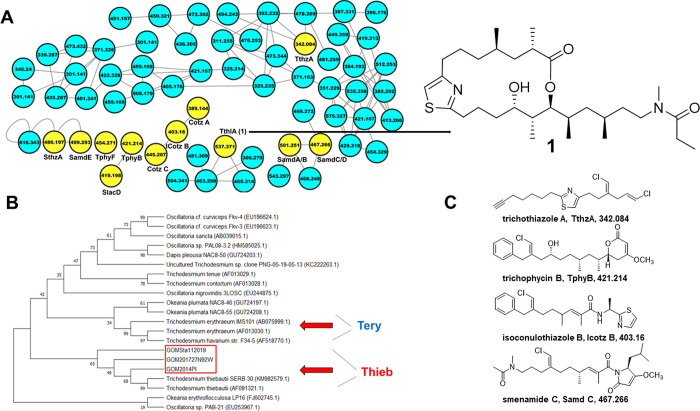
Figure 2.
(A) T. thiebautii specialized metabolites in “picked colonies”. Partial LC-MS/MS-based molecular network of extract from GoM2019-11. Colonies were hand-picked with a sterile loop from bulk collection, and an extract was generated. An arrow points from node m/z 537 (ThlA) to the trichothilone A (1) structure. Yellow nodes in panel (A) indicate that these metabolites were previously characterized by our group (cf. Figure S4). The full network can be found at http://gnps.ucsd.edu/ProteoSAFe/status.jsp?task=9b6cefbe17c44ecf897caec9aba38031 (picked colonies–total number of nodes 241). (B) 16S rRNA phylogenetic tree aligning Trichodesmium species from this study (red box—PI2014, GoM 2017, and GoM2019-11). All samples clustered with T. thiebautii. The tree was created using the Maximum Likelihood method and the Tamura-Nei model. The bootstrap consensus tree is inferred from 1000 replicates, and the percentage of replicate trees in which the associated taxa clustered together in the bootstrap test are shown next to branches. Analysis was conducted in MEGA. GenBank accession numbers of sequences are noted in parentheses. Red arrows show clusters for T. erythraeum (Tery) and T. thiebautii (Thieb). (C) Representative structures that have been characterized from Trichodesmium collections previously and were found in the “picked colonies” molecular network with their names, abbreviations, and m/z values below the structures.

