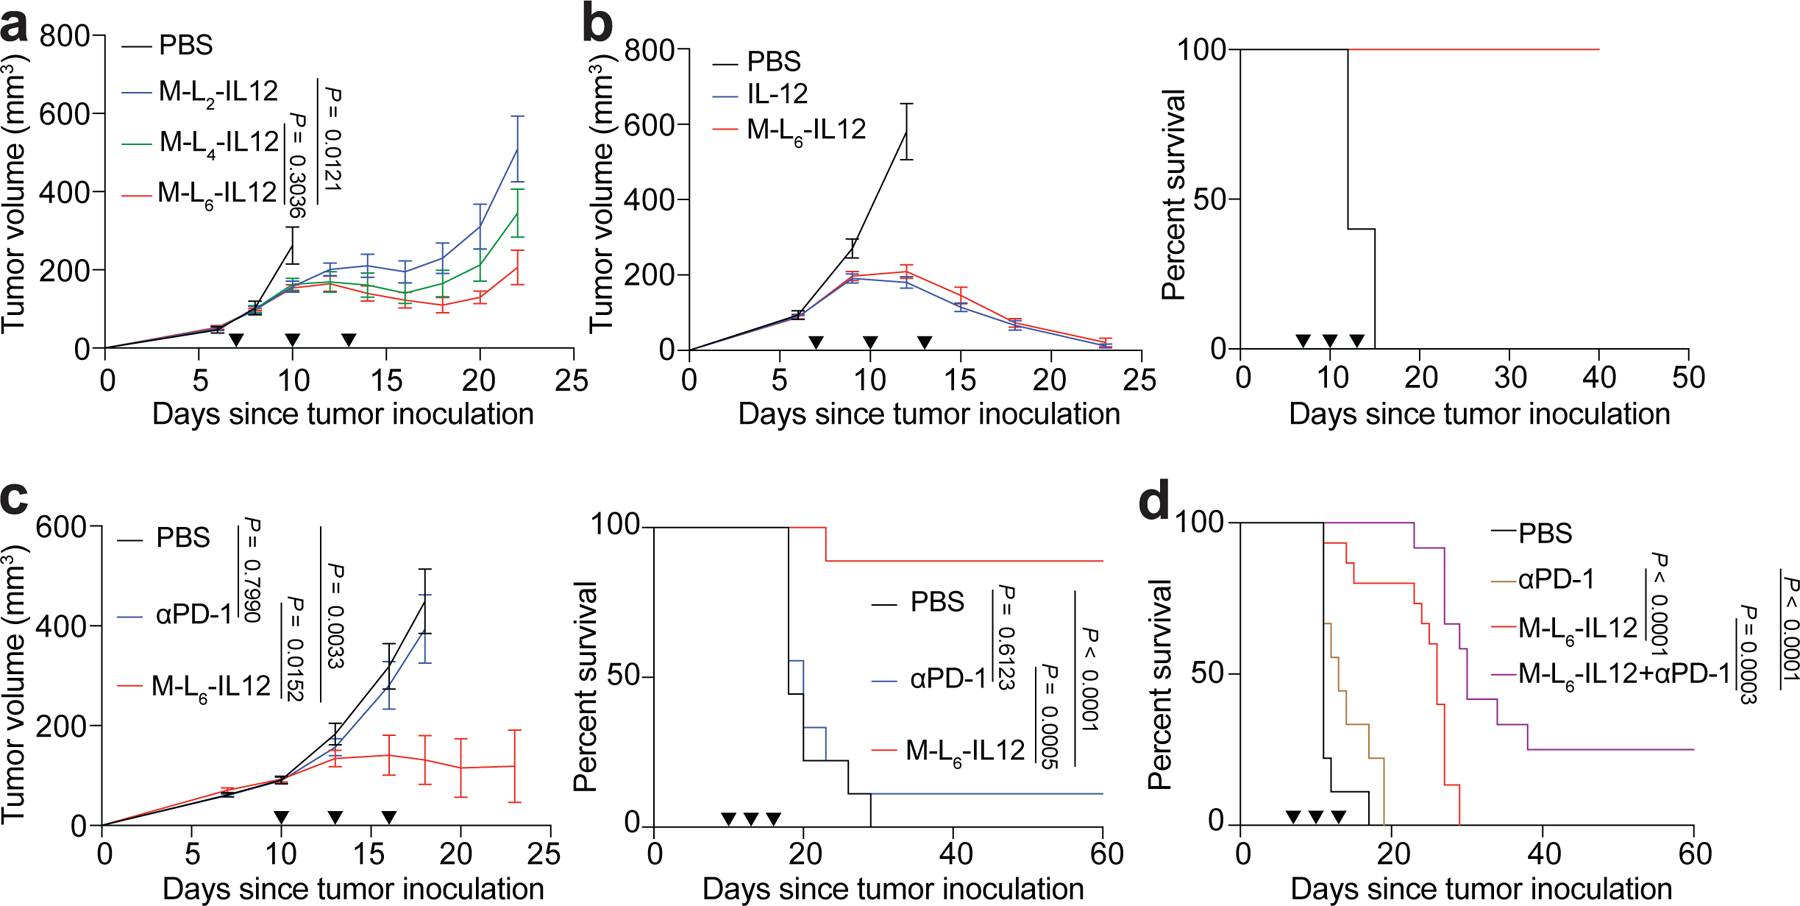
Fig. 2 |. Masked IL-12 induces a strong antitumour response and potentiates CPI therapy.

a, B16F10 melanoma-bearing mice were treated with PBS (n=6), or 250 pmol of M-L2-IL12 (n=7), M-L4-IL12 (n=8), M-L6-IL12 (n=7) i.v. on days 7, 10 and 13 post tumour inoculation. Tumour growth curves are shown. b, Subcutaneous MC38 colon adenocarcinoma-bearing mice were treated with PBS (n=5), 5 μg (83.3 pmol) IL-12 (n=7) or 250 pmol of M-L6-IL12 (n=7) i.v. on days 7, 10 and 13 post tumour inoculation. Tumour growth curves (left) and survival (right) are shown. c, Orthotopic EMT6 mammary carcinoma-bearing mice were treated with PBS (n=9), αPD-1 (n=9, 100 μg, i.p.) or M-L6-IL12 (n=9, 250 pmol, i.v.) on days 10, 13 and 16 post tumour inoculation. Tumour growth curves (left) and survival (right) are shown. d, Orthotopic B16F10 melanoma-bearing mice were treated with PBS (n=9), αPD-1 (n=9, 100 μg, i.p.), M-L6-IL12 (n=15, 250 pmol, i.v.) or M-L6-IL12 + αPD-1 (n=12) on days 7, 10 and 13 post tumour inoculation. Survival curves are shown. Data are mean ± s.e.m. Arrowheads indicate times of treatment. Experiments in a,b,c were performed twice with similar results. Data in d were pooled from two independent experiments. Statistical analyses were performed using ordinary one-way ANOVA with Tukey’s multiple comparison tests. For survival plots, Mantel-Cox test was used.
