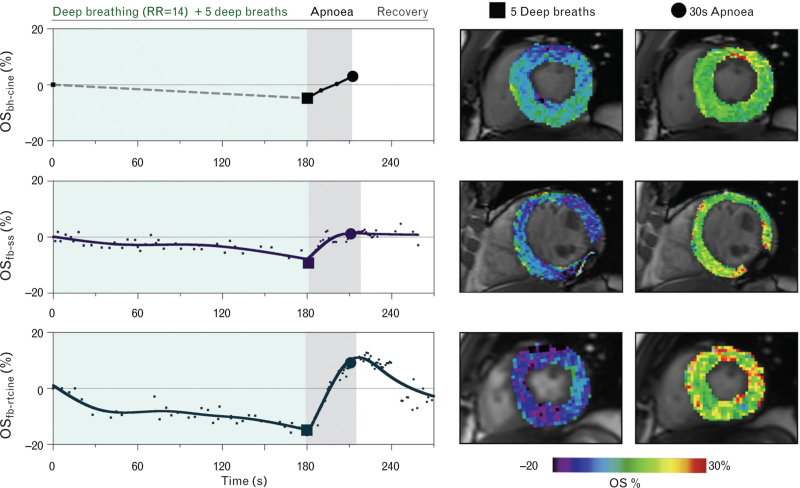
Fig. 4.
Case example of myocardial oxygenation changes.
The change in myocardial oxygenation is shown for all three sequences in the same individual during three repeated runs of a simulated induction breathing protocol. Dashed line indicates that data were not acquired during the paced breathing for the original breath-hold oxygenation-sensitive cine (top, OS-bhcine), whereas data were acquired throughout the entire manoeuvre for both free-breathing variants, the single-shot (middle, OSfb-ss) and real-time cine (bottom, OSfb-rtcine). Colour maps depict the %-change in myocardial oxygenation between baseline and at the end of five deep breaths, and for the change from the five deep breaths to 30 s of apnoea. Cines are displayed at end-systolic frames, whereas only a diastolic frame was available for the single shot. RR, respiration rate.

